Anteriormente se aprendió a manipular una gran cantidad de datos. Aprendiste cómo importar un archivo de texto, cómo eliminar una o varias columnas y filas, así como también cómo obtener datos de acuerdo a una determinada condición. Ahora es tiempo de aprender cómo analizar tus resultados. En esta sección, aprenderás cómo graficar tus resultados, especialmente en el tiempo.
Anteriormente se aprendió a manipular una gran cantidad de datos. Aprendiste cómo importar un archivo de texto, cómo eliminar una o varias columnas y filas, así como también cómo obtener datos de acuerdo a una determinada condición. Ahora es tiempo de aprender cómo analizar tus resultados. En esta sección, aprenderás cómo graficar tus resultados, especialmente en el tiempo.
Antes de comenzar, solo escribiré el código de Python del tutorial anterior necesario para este ejercicio (ir a Python: Pandas DataFrame manipulación de datos).
#Importing library
import pandas as pd


#Getting data from the text file
df = pd.read_csv('vaccinations.txt', header = None, skiprows = (1), sep = ',', quotechar = None, quoting = 3)


#Setting a header for the DataFrame
df.columns = ['Country','Country iso code','Date','Total vaccinations','People vaccinated','People fully vaccinated','Total boosters','Daily vaccinations raw','Daily vaccinations','Total vaccinations per hundred','People vaccinated per hundred','People fully vaccinated per hundred','Total boosters per hundred','Daily vaccinations per million','Daily people vaccinated','Daily people vaccinated per hundred']


#Printing the DataFrame
print(df)


#Getting data per country
country = input('Please type your country of interest:')
df_country = df[df['Country'] == country]


#Printing the column Date of the the DataFrame df_country
print(df_country['Date'])
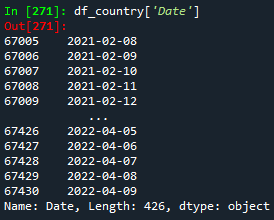
Si ejecutamos este código, notaremos que la columna Date es de tipo object, como se ve a continuación:

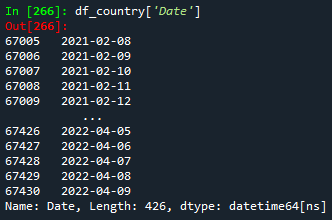
Ahora, aprenderemos cómo graficar datos de fecha. Para este propósito, convertiremos la columna Date de un tipo object a un tipo datetime. El formato datetime ayudará a obtener un mejor gráfico.
#Converting date to datetime format
df_country['Date'] = pd.to_datetime(df_country['Date'])
df_country.sort_values('Date', inplace=True)


#Printing the column Date of the DataFrame df_country
print(df_country['Date'])

Python tiene una librería llamada matplotlib.pyplot que se utiliza para graficar. Una vez que se importa esta librería, podemos elegir el estilo de trazado.
#Importing library
import matplotlib.pyplot as plt


#Choosing the plot style
plt.style.use('seaborn')
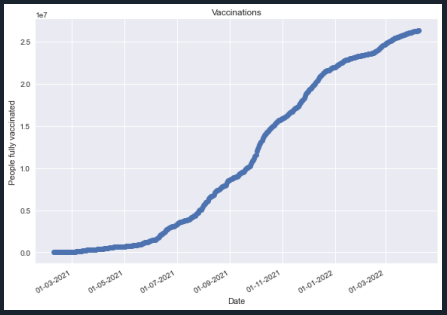
Ahora, necesitamos establecer los valores de los ejes x e y. Graficaremos la cantidad de personas completamente vacunadas a lo largo del tiempo para el país especificado por el usuario.
#Setting the axis values
x = df_country['Date']
y = df_country['People fully vaccinated']
Una vez que se definen los valores de los ejes, podemos comenzar a graficar. Para ello, le daremos el formato de fecha al eje x. Para hacerlo, se necesita la librería dates de la librería matplotlib. También estableceremos nombres para los ejes x e y, así como para el gráfico.
#Importing library
from matplotlib import dates as mpl_dates


#Making the graph
plt.plot_date(x,y)


#Giving date format to the x-axis
plt.gcf().autofmt_xdate()
date_format = mpl_dates.DateFormatter('%d-%m-%Y')
plt.gca().xaxis.set_major_formatter(date_format)
plt.tight_layout()


#Naming both axis and the graph
plt.xlabel('Date')
plt.ylabel('People fully vaccinated')
plt.title('Vaccinations')
plt.show()

Luego, el código final de Python se verá así:
#Importing library
import pandas as pd
import matplotlib.pyplot as plt
from matplotlib import dates as mpl_dates


#Getting data from the text file
df = pd.read_csv('vaccinations.txt', header = None, skiprows = (1), sep = ',', quotechar = None, quoting = 3)


#Setting a header for the DataFrame
df.columns = ['Country','Country iso code','Date','Total vaccinations','People vaccinated','People fully vaccinated','Total boosters','Daily vaccinations raw','Daily vaccinations','Total vaccinations per hundred','People vaccinated per hundred','People fully vaccinated per hundred','Total boosters per hundred','Daily vaccinations per million','Daily people vaccinated','Daily people vaccinated per hundred']


#Printing the DataFrame
print(df)


#Getting data per country
country = input('Please type your country of interest:')
df_country = df[df['Country'] == country]


#Printing the column Date of the the DataFrame df_country
print(df_country['Date'])


#Plotting


#Converting date to datetime format
df_country['Date'] = pd.to_datetime(df_country['Date'])
df_country.sort_values('Date', inplace=True)


#Printing the column Date of the DataFrame df_country
print(df_country['Date'])


#Choosing the plot style
plt.style.use('seaborn')


#Setting the axis values
x = df_country['Date']
y = df_country['People fully vaccinated']


#Making the graph
plt.plot_date(x,y)


#Giving date format to the x-axis
plt.gcf().autofmt_xdate()
date_format = mpl_dates.DateFormatter('%d-%m-%Y')
plt.gca().xaxis.set_major_formatter(date_format)
plt.tight_layout()


#Naming both axis and the graph
plt.xlabel('Date')
plt.ylabel('People fully vaccinated')
plt.title('Vaccinations')
plt.show()
¡Felicidades! ¡Ahora, también puede graficar datos que contienen formato de fecha! Te estás convirtiendo en un experto en Python. ¡A seguir aprendiendo! Para descargar el código completo y el archivo de texto con los datos usados en este tutorial, haz click aquí.
Vistas: 1
Notificaciones
Recibe los nuevos artículos en tu correo electrónico


