
Currently more and more companies from different sectors are opting for data science. As was previously seen, due to the fact that we currently work with a large amount of data, knowing how to manipulate said data using a programming language becomes extremely important.
Currently more and more companies from different sectors are opting for data science. As was previously seen, due to the fact that we currently work with a large amount of data, knowing how to manipulate said data using a programming language becomes extremely important.
As learnt previously (please go to Python: Pandas DataFrame data manipulation), the pandas library is a very friendly method when it comes to manipulating data since it allows you to visualize them in an orderly manner as in an Excel sheet (in a table by rows and columns). However, there is another method just as important. The second method is the numpy library. This library will sort the data into lists that can be treated as vectors or matrices depending on their dimension. In this exercise, we will see how to manipulate data using this library.
Before we start, let's remember our high school Math class. What is a matrix? A matrix is a way to sort numbers by rows and columns to form a rectangular array. An example of a matrix can be the following:
As seen above, the matrix has 2 rows and 4 columns. In other words, it has dimensions 2x4. In case the number of rows and columns are the same, the matrix becomes square. In programming, if the matrix has only one row, it is commonly known as a row-vector, and if it has only one column, it is a column-vector.
You can get one specific element of the matrix by knowing its position. For example, the element in position 2, 4 is the number 8. How to understand this? Well, it is very simple! The first number 2 means the row (second row), and the number 4 is the column (fourth column) where the element is located. Said this, when you work with an array in Python, think about matrices! Let's start coding!
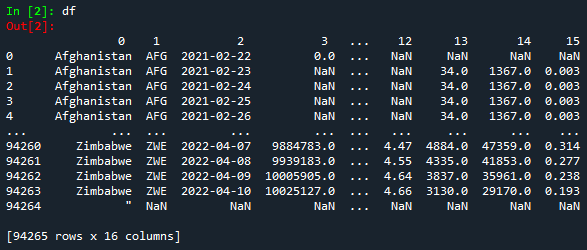
For this exercise, we will work with the data we downloaded from the web (please go to Python: Downloading data from the web"). The first thing we must do is to import the text file into Python. We will use the library pandas for this.
#Importing library
import pandas as pd


#Importing the .txt file
df = pd.read_csv('vaccinations.txt', header = None, skiprows = (1), sep = ',', quotechar = None, quoting = 3)
print(df)
Since our objective is to work with the numpy library, we will convert the DataFrame to an array.
#Converting the DataFrame into array
array_data = np.array(df)
print(array_data)
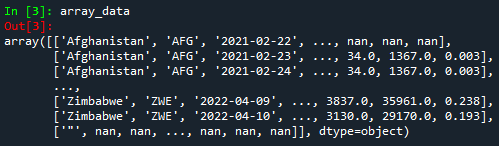
If you pay attention to the figure above, you will notice that every line is inside the square brackets ('[ ]') and each element is separated by the delimiter comma (',')). This means that everything which is inside the square brackets represents a row, and each element inside represents a column.
Python starts counting the number of rows and columns from 0. This means, for example, the element in that array with position 2, 1 will be 'AFG', or the element with position 0, 2 will be '2021-02-22'.
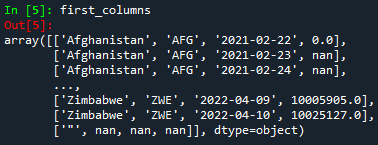
Now, let's start manipulating data. In a similar way to DataFrame, we can get the first 5 rows (with all columns) and the first 5 columns (with all rows).
#Selecting the first 5 rows (from 0 to 4)
first_rows = array_data[:5,:]
print(first_rows)


#Selecting the first 4 columns (from 0 to 3)
first_columns = array_data[:,:4]
print(first_columns)
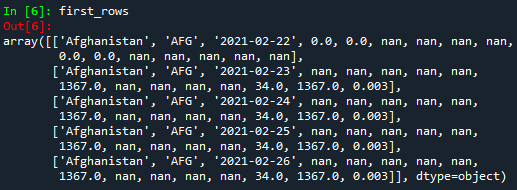
But...how to understand the code above? Well, it is very simple! For example, in the first case, [:5,:] the comma ',' delimiters the rows and columns. In order to select all rows or columns, the colon ':' is used. In the case of the rows, :5 means that all first 5 rows will be taken into account. Since Python starts counting from 0, the first rows will be 0, 1, 2, 3, and 4. Please notice that row 5 is not included!
Now, let's copy the array into another array in order to keep the original one.
#Copying the array to another array
array_copy = array_data.copy()
print(array_copy)
Let's now learn how to delete specific rows and columns. For this purpose, the function numpy.delete() is needed.
#Removing one or multiple rows
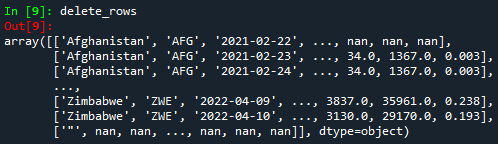
delete_rows = np.delete(array_data, [100, 525, 9461], axis=0)
print(delete_rows)
#Removing one or multiple columns
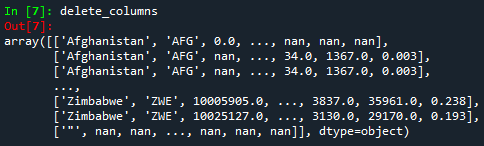
delete_columns = np.delete(array_data, [2,7,11], axis=1)
print(delete_columns)
Please note that in the code above, axis=0 stands for deleting rows, while axis=1 stands for columns. After running the code, we will get the following:
Since it is not visible that we just deleted specific rows and columns, let's prove it! In order to prove it, we can ask Python to give us the dimensions of the new arrays ('delete_rows' and 'delete_columns') and the array 'array data'. For this, we will use the function numpy.size().
#Comparing arrays


#Getting the number of columns
rows1 = np. size(array_data, 1)
print(rows1)
rows2 = np. size(delete_columns, 1)
print(rows2)


#Getting the number of rows
columns1 = np. size(array_data, 0)
print(columns1)
columns2 = np. size(delete_rows, 0)
print(columns2)
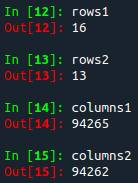
In the picture above, variables 'rows1' and 'columns1' are the dimensions of the original array 'array data', while the variables 'rows1' and 'columns1' are the dimensions of the same array after deleting rows [100, 525, 9461], and columns [2,7,11]. Notice that the number of rows and columns has decreased as it should since we have deleted 3 rows and 3 columns.
Now, let's get specific values according to a certain condition. For example, we will get the data only for one specific country: Peru. We can use the function input in order for the user to enter his/her desired country.
#Getting data per country (Selecting all rows where the first column is equal to 'country')
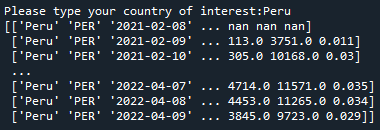
country = input('Please type your country of interest:')
array_data_country = array_data[array_data[:,0] == country]
print(array_data_country)
Like in the previous tutorial about the pandas library, we will export the user-input array into Excel. The easiest way to achieve this is by converting the array into DataFrame (using the pandas.DataFrame() function), and then exporting it to Excel (using the df.to_excel() function) as shown in the previous tutorial.
However, there is another way to export a numpy array, which will be shown in this tutorial. The first thing we must do is to import the library xlswriter. Then, we should 'open' an Excel workbook and sheet using Python coding. For this, there are special functions in Python as shown:
#Exporting array to Excel
import xlsxwriter


#Creating the Excel file


#Creating the workbook
workbook = xlsxwriter.Workbook('Vaccinations by country.xlsx')
#Creating the worksheet
worksheet = workbook.add_worksheet()
After creating the Excel file, before starting exporting the array, we should first set a header for it. For this, we create a list in Python with the different column names for the header, and then we must iterate through each element of that list and write it in the first row in Excel.
#Getting data per country (Selecting all rows where the first column is equal to 'country')
country = input('Please type your country of interest:')
array_data_country = array_data[array_data[:,0] == country]
print(array_data_country)
Please do not forget that Python starts counting from 0! That is why we set the row equal to zero. The function enumerate(header) tells Python to iterate through each element of the list header. Then, the function worksheet.write() will write the iterated data in the first row in Excel. Now, it is time to do the same, but for the data itself! We will apply the same logic as for the header.
#Iterating over the array data to export to Excel
column = 0


for row, data in enumerate(array_data_country):
    try:
        worksheet.write_row(row+1, column, data)
    except:
        pass
The final step to do is to close the Excel file using the function workbook.close().
workbook.close()
After running this code, you will find the created Excel file in the same directory as your Python file.
The complete code will look like this:
#Importing the library
import numpy as np
import pandas as pd
import xlsxwriter


#Importing the .txt file
df = pd.read_csv('vaccinations.txt', header = None, skiprows = (1), sep = ',', quotechar = None, quoting = 3)
print(df)


#Converting the DataFrame into array
array_data = np.array(df)
print(array_data)


#Selecting the first 5 rows (from 0 to 4)
first_rows = array_data[:5,:]
print(first_rows)


#Selecting the first 4 columns (from 0 to 3)
first_columns = array_data[:,:4]
print(first_columns)


#Copying the array to another array
array_copy = array_data.copy()
print(array_copy)


#Removing one or multiple columns
delete_columns = np.delete(array_data, [2,7,11], axis=1)
print(delete_columns)


#Removing one or multiple rows
delete_rows = np.delete(array_data, [100, 525, 9461], axis=0)
print(delete_rows)


#Comparing arrays


#Getting the number of columns
rows1 = np. size(array_data, 1)
print(rows1)
rows2 = np. size(delete_columns, 1)
print(rows2)


#Getting the number of rows
columns1 = np. size(array_data, 0)
print(columns1)
columns2 = np. size(delete_rows, 0)
print(columns2)


#Getting data per country (Selecting all rows where the first column is equal to 'country')
country = input('Please type your country of interest:')
array_data_country = array_data[array_data[:,0] == country]
print(array_data_country)


#Exporting array to Excel


#Creating the Excel file

#Creating the workbook
workbook = xlsxwriter.Workbook('Vaccinations by country.xlsx')
#Creating the worksheet
worksheet = workbook.add_worksheet()


#Creating a list for the header in Excel
header = ['Country','Country iso code','Date','Total vaccinations','People vaccinated','People fully vaccinated','Total boosters','Daily vaccinations raw','Daily vaccinations','Total vaccinations per hundred','People vaccinated per hundred','People fully vaccinated per hundred','Total boosters per hundred','Daily vaccinations per million','Daily people vaccinated','Daily people vaccinated per hundred']


#Iterating over the header to create the first row in Excel
row_header = 0
for column_header, data_header in enumerate(header):
    worksheet.write(row_header, column_header, data_header)


#Iterating over the array data to export to Excel
column = 0


for row, data in enumerate(array_data_country):
    try:
        worksheet.write_row(row+1, column, data)
    except:
        pass


workbook.close()
Congratulations! Now you became an expert in data manipulation with Pandas DataFrame and Numpy array! To download the complete code and the text file containing the data used in this tutorial, please click here.
Views: 1 Github
Related Articles


Notifications
Receive the new articles in your email
Other Articles

Make money with dividends. The secret
stats con chris

Japanese candlesticks. A complete explanation for beginners
stats con chris

Why do altcoins follow bitcoin trend against the dollar
stats con chris

12 interesting facts about living in the Andes
stats con chris

The quest for the world order: The Middle East
stats con chris