
We set the path that gives the highest probability to win a ticket for the final match of the FIFA World Cup. This consists of buying tickets in category 1 with the option to accept tickets in a lower category. For this analysis we have considered data from the 2018 FIFA World Cup; however, the conclusions obtained are valid for any World Cup.
We set the path that gives the highest probability to win a ticket for the final match of the FIFA World Cup. This consists of buying tickets in category 1 with the option to accept tickets in a lower category. For this analysis we have considered data from the 2018 FIFA World Cup; however, the conclusions obtained are valid for any World Cup.
A summary of this article with some extra info appears in the following video:
Do you want to win a ticket to the FIFA World Cup final match? You should know that this is the ticket that has the highest demand and therefore to get it you will have to participate in a raffle, which you will hardly win unless you use mathematics. In this article we will discover the path that we must follow to have greater chances of winning the raffle, to do so, we will take into account the data from the 2018 FIFA World Cup; however, you must bear in mind that the analysis and the conclusions given apply to any World Cup.
In the case of Russia 2018, the final match was played at the Luzhniki stadium in Moscow, which could hold 81,000 people. Considering that in 2018 the world population was around 7 billion, this implies that the number of seats available in the stadium was equivalent to ∼0.001% of the total number of people in the world, that is, at least, the chances of winning a ticket to the final match were above this value... Having defined this lower bound, let's start with the analysis.
| The seats by category | |
|---|---|
| Category 1 | Category 2 |
 |
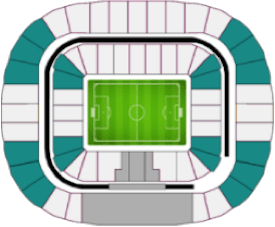 |
| Category 3 | Category 4 |
 |
 |
As we can see in Table I, the seats of the Luzhniki stadium in Moscow were divided into four categories: i) category 1, ii) category 2, iii) category 3, and iv) category 4. Moreover, there is a region that is shaded in gray. In this article, this region is called category 0 and corresponds to the seats reserved for FIFA members and their relatives. This is common in all FIFA World Cups. Therefore, the number of seats available to the public are all except category 0. Making an exact count for the case of Russia 2018, we obtain that there are $c_1 + c_2 + c_3 + c_4 =$ 69,096 seats, where $c_j $ represents the number of seats available in category $j$. To determine the probability of winning the ticket draw in each category we will use basic concepts of probability theory, which were explained in the article: "Probability theory in the FIFA World Cup Qualifiers." The truth is that we don't know how many people participate in the FIFA draw; however, to solve this we consider what FIFA's marketing director once said in 2018:
"The number of applicants is at least 10 times more than the number of seats available" - Thierry Well, FIFA Marketing Director (2018).
"The number of applicants is at least 10 times more than the number of seats available" - Thierry Well, FIFA Marketing Director (2018).
This means that if the stadium has 69,096 seats available, at least 690,960 people will apply. An important point to note is that, for example, in the 2014 FIFA World Cup, the sale of tickets for the final match was divided into two parts. Approximately 60% were drawn in the first phase and 40% in the second phase. In the 2018 FIFA World Cup it was different, the tickets for the final match were drawn in a single phase. In the coming World Cups you must keep this difference in mind, it could be in phases or in a single draw. Here, to ease the discussion, we are going to consider a single draw, as it happened in Russia 2018. In this sense, our analysis focuses on a total of 690,960 applicants for 69,096 seats, or in general, $t$ applicants for $t/10$ seats. An important fact of the draw is that you can choose the category that you want, category 1 is usually the most expensive, while category 4 is the cheapest; therefore, it is obvious that not everyone will be able to choose category 1 because it implies more expenses. To simplify the analysis, we are going to say that 60% of the applicants chooses to apply to category 1 and therefore the remaining 40% will apply to the other categories. Then, we repeat the process, that is, of that remaining 40%, 60% will apply to category 2 and the remaining 40% to the lower categories. In this way we obtain:
where $t_j$ represents the total number of applicants who apply directly to category $j$. In order to separate $t_3$ and $t_4$ we must bear in mind that: i) Category 4 is exclusive to residents, that is, foreigners cannot apply to it. ii) In each World Cup it is common to have a higher percentage of residents than foreigners. For simplicity, we consider the ratio 60-40, i.e., in any draw, 60% will be residents and 40% will be foreigners. With this we can obtain the following:
where the first term represents the number of residents and the second term the number of foreigners. Of the residents, 60% will apply to category 3 and the remaining percentage to category 4. With this, we finally have:
Summarizing, from Eqs. (1), (2), (5) and (6) we have:
From Table II we can see that $t_1 + t_2 + t_3 + t_4 = t$; however, we have to pay attention to the fact that FIFA allows that those who do not win the draw in one category can be transferred to the draw in another category. Although there is no exact explanation of this mechanism, here we will assume the following: "Those who apply to category 1 and don't win, will be transferred if they wish to the draw for category 2. A similar process is assumed for the lower categories." Therefore, the total number of applicants in a category is given by the sum of those who apply directly to it plus the ones who lost in the upper category draw; of course, it is possible that a certain number of applicants that lost a draw decide to not participate in the draw of a lower category, but these are likely very few since an event like the final match cannot be so easily missed. Therefore, we are going to consider that only 10% of those who lose the draw do not accept to participate in the draw of a lower category. In this way we would have the following results:
$t_j^*$ represents the total number of applicants who apply to category $j$, including those who lost the draw in an upper category. In Eq. (10) we add a factor of 60% because we must recall that only residents apply to category 4. If category $j$ has $c_j$ seats and $t_j^*$ applicants, then the probability $p_j$ of winning a ticket in category $j$ is $(c_j/t_j^*)\times 100$. Therefore, to obtain this probability, it is enough to know the number of seats available in each category and recall the following relationship:
Replacing Eq. (11) in Table II and the values of $t_j$ in Eqs. (7), (8), (9) and (10), we obtain $p_j$. In the case of the 2018 FIFA World Cup, the result is as follows:
As we can see in Table III, the probability of winning is greater if one applies to category 1. This is because it has more seats and the applicants are given entirely by those who apply directly. Keep in mind that this probability is given if you only apply to a specific category, what is left to answer is: "What is the probability of winning a ticket to the World Cup final match if you apply to category 1 with the option to accept a ticket in a lower category? In this case, for foreigners we have:
$p_j$ represents the winning probability in category $j$. Unlike the value given in Table III, in Eq. (12), $p_j$ is expressed in decimals. As we can see, the total probability for foreigners, $P_f$, is the sum of three probabilities. The first term is the winning probability in category 1, the second term is the winning probability in category 2 having lost in category 1, and the third term is the winning probability in category 3 having lost in the upper categories. Solving Eq. (12) we get $P_f=13.79\%$. In the case of residents, we have:
As you can see, for the case of residents we add one more term corresponding to the winning probability in category 4 having lost in the upper categories. Therefore, the total probability is $P_r=14.47\%$. In conclusion, we can say that the most effective method to win a ticket to the FIFA World Cup final match is by applying to category 1 with the option to accept a ticket in a lower category. By doing this, your chances are doubled with respect to applying only to category 1. Of course, you must bear in mind that we have omitted several factors, such as the fact that one can buy more than one ticket at a time. Additionally, in this analysis we have assumed that the number of applicants is only 10 times more than the number of seats available, but for the final match it may be up to 20 times more. In any case the numbers given here are not correct, your real chances are much lower; nonetheless, by applying to category 1 with the option to accept a ticket in a lower category remains the most effective way to win a ticket for the final match, this is the key message that you need to take home.
Views: 1 Sports
Related Articles


Notifications
Receive the new articles in your email
Other Articles

Living in Japan. Breakfast, lunch, and dinner
stats con chris

Python: Tracking any phone number
joushe info

Make money with dividends. The secret
stats con chris

Death Note. The day I met the manga characters in Tokyo
stats con chris