Six-color candles
Nowadays it is difficult to find charts with six-color candles because most investment platforms prefer two-color candles. The cryptocurrency platform Bitstamp, for example, used to have these candles in the past, but over time they changed to the two-color candles.
Fig. 7 shows us what Bitstamp's chart looked like, back in the days when they used six-color candles. As an example, we are considering the fluctuation of bitcoins per minute, that is, each candle is equivalent to one minute.
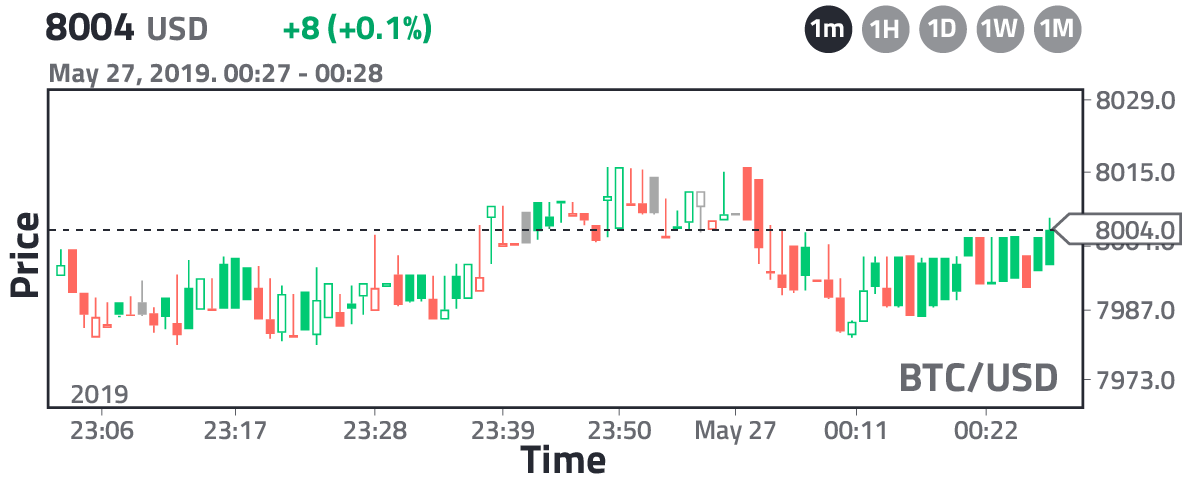
As you can see, in contrast to the two-color candles, here we have six: i) solid green, ii) hollow green, iii) solid red, iv) hollow red, v) solid gray, and vi) hollow gray. We can separate them into two groups:
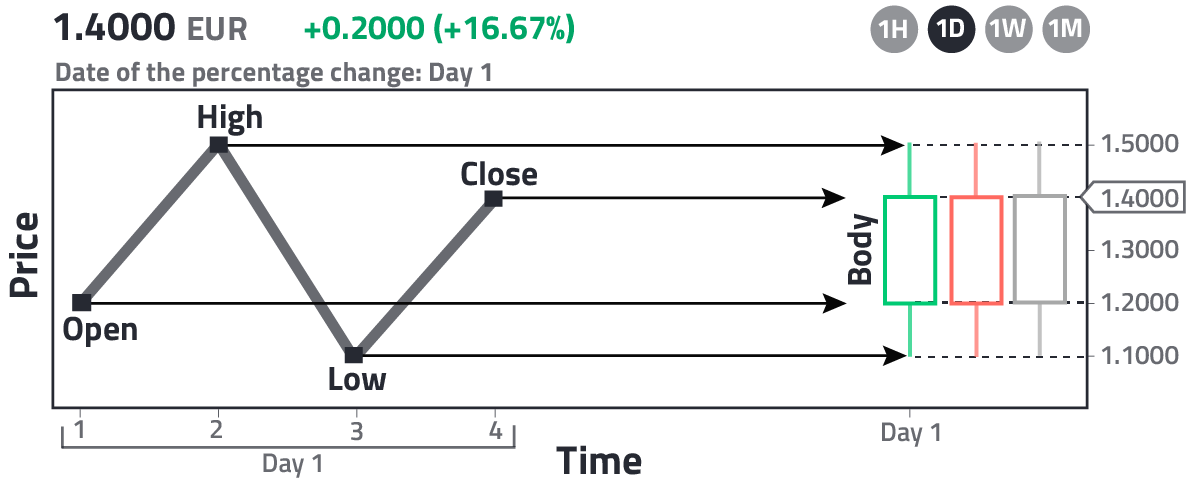
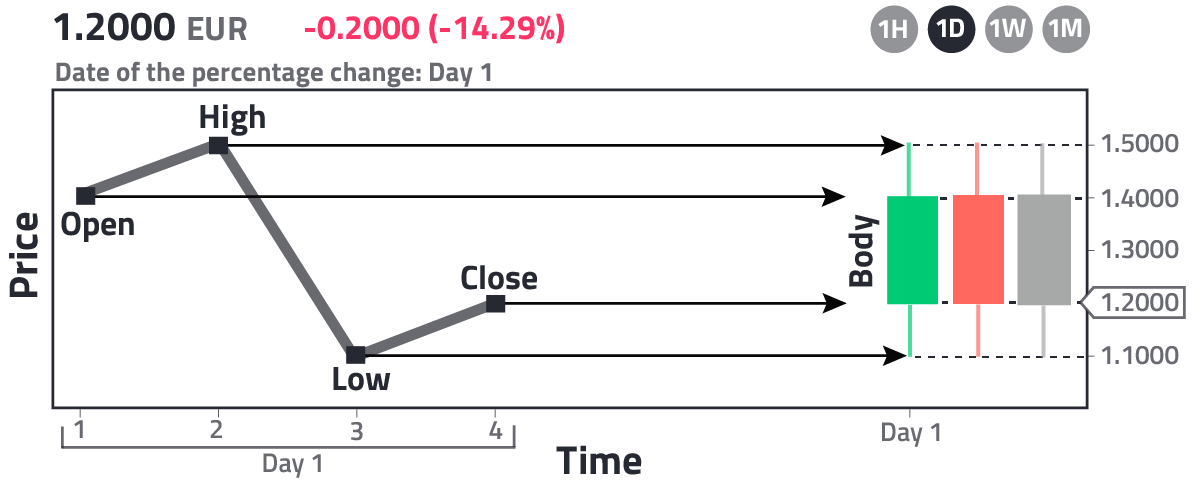
Fig. 8 shows the group of hollow candles and Fig. 9 shows the group of solid candles. As you can see, a hollow candle, regardless of its color, indicates that the price is growing (the opening price is lower than the closing price). Similarly, a solid candle, regardless of its color, indicates that the price is falling (the opening price is higher than the closing price). To understand the meaning of the colors, let's consider Figs. 10 and 11:
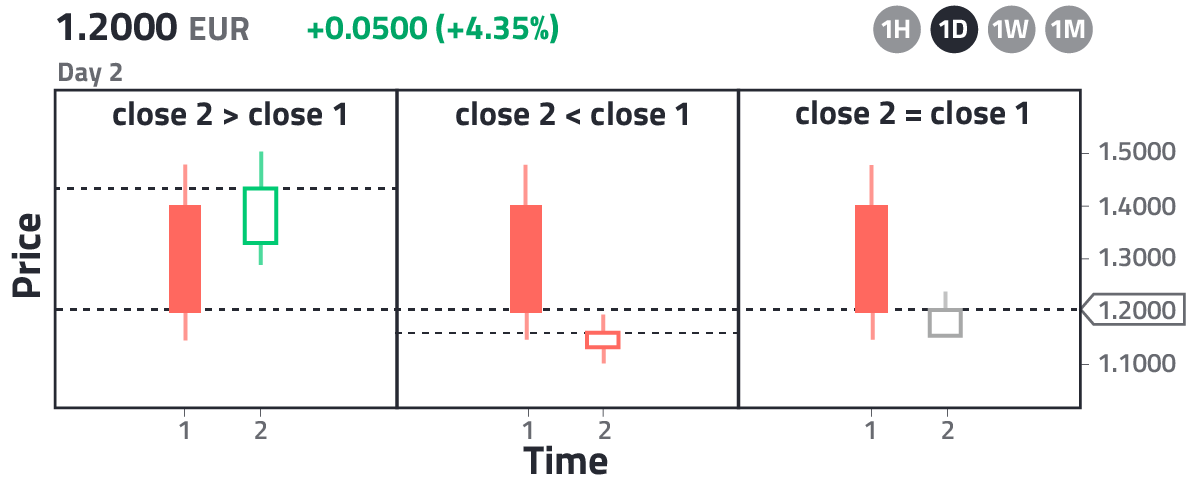
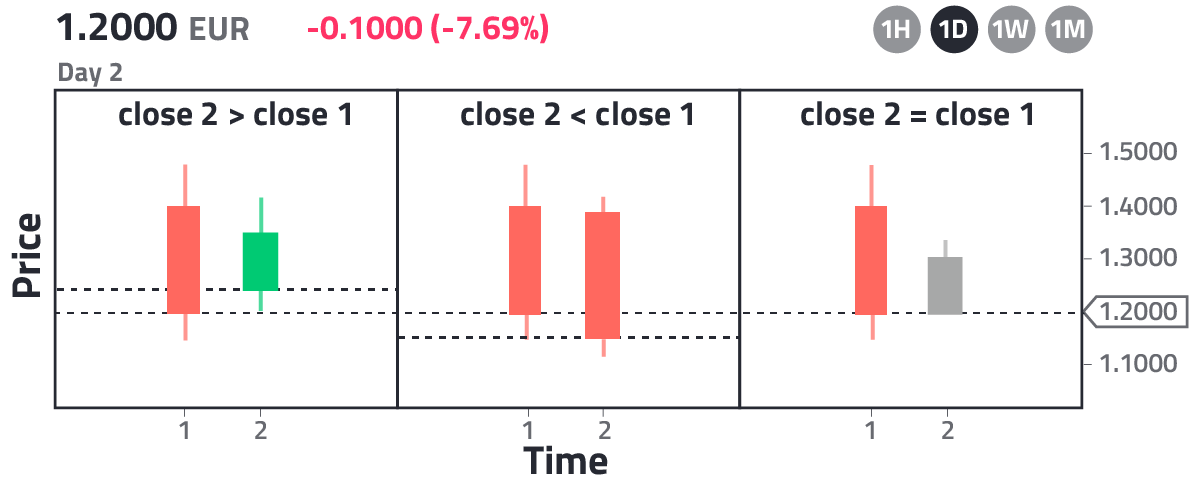
In Figs. 10 and 11 we consider charts with 2 time intervals, t = 1 and t = 2. If t equals 1 minute, then t = 1 is the first minute and t = 2 is the second minute. For simplicity, in all cases, we choose the first candle (at t = 1) to be a solid red candle. Independent of this first candle, we can set the second candle to be hollow or solid. In Fig. 10 we depict the hollow ones and in Fig. 11 the solid ones. We already said that the hollow ones show that the asset is growing, while the solid ones show that the asset is falling. The color of the second candle (at t = 2) is to differentiate it from the previous one (at t = 1). It is colored green when the closing price at t = 2 is greater than the closing price at t = 1 (close 2 > close 1). It is colored red when the closing price at t = 2 is lower than the closing price at t = 1 (close 2 < close 1). And finally, it is colored gray when the closing price at t = 2 is equal to the closing price at t = 1 (close 2 = close 1). Consequently, in contrast to the two-color candles, the six-color candles give us some extra information, e.g., a hollow green candle represents total growth, that is, it grows in its interval and also with respect to the previous candle, while a solid red candle represents a total fall, it falls in its interval and also with respect to the previous candle.
With this information now you have a solid understanding of what Japanese candlesticks are.
Views: 1
Related Articles


Notifications
Receive the new articles in your email
Other Articles

Python: Tracking any phone number
joushe info

PHP algorithm to simulate the FIFA World Cup draw
stats con chris

Death Note. The day I met the manga characters in Tokyo
stats con chris

Invest in cryptocurrencies. The math behind the trading fees
stats con chris

Git in Ubuntu Linux
joushe info