
Considering linear extrapolation, we predict that Despacito becomes the most viewed video on YouTube, reaching the figure of 3 billion views in August 2017. Officially it did it on Aug. 5th (European time). The concepts exposed here are part of an introduction to data science. The code was developed in Python.
Considering linear extrapolation, we predict that Despacito becomes the most viewed video on YouTube, reaching the figure of 3 billion views in August 2017. Officially it did it on Aug. 5th (European time). The concepts exposed here are part of an introduction to data science. The code was developed in Python.
A summary of this article with some extra info appears in the following video:
On April 20th, 2017, I was in Milan. That night, the first word that I heard when I arrived at the Naviglio Pavese was “Despacito.” It was funny to hear that, but when I heard it again and again whenever a group of people crossed by my side, I realized that something strange was happening… and I was not mistaken, that day, the song Despacito by Luis Fonsi had reached one billion views on Youtube. The next day, I traveled to Munich and the first thing that I did when I arrived was to ask a German friend if she knew the song. She was a rock fan, so she said no, but two months later when I spoke to her again, she told me that she could no longer tolerate it, she was hearing it everywhere. Just two months later, on June 20th, 2017, Despacito had reached 2 billion views on YouTube. After this, the world’s media began to pay attention to this Latin phenomenon, especially because on July 10th, 2017, See You Again (Wiz Khalifa) surpassed Gangnam Style (PSY) and became the most viewed video on YouTube:
Therefore, checking the ranking (R) given in Table I, a world question arose: "Will Despacito be able to surpass See You Again?" Curiously, the answer to this question is found in mathematics and that is why today, many financial institutions are obsessed recruiting mathematicians because they are the new oracles of the world, capable of predicting the future and generating strong profits with their mathematical models.
It was on July 4th, 2017 that I decided to answer this question, and for this, every 24 hours, I began to annotate on a sheet of paper the number of views on Youtube for each song. The results appear below:
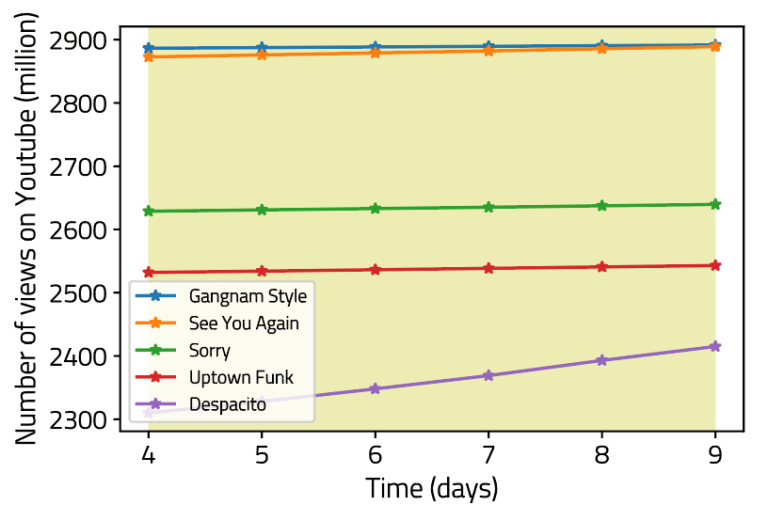
In Fig. 1, the vertical axis refers to the total number of Youtube views and the horizontal axis refers to the time interval expressed in days. As you can see, we have 6 data for each song, which span from July 4th to July 9th. By simple inspection we can say that all songs exhibit a linear trend, that is, the total number of Youtube views vs time can be given by drawing lines. If we extrapolate these lines, at some point in time they will intersect, and this intersection will define the moment when one song surpasses the other one in number of views. So in this article, that's what we will do, and with that we will answer not only if Despacito will surpass See You Again, but also when will it do it. Mathematically, this approach is called linear extrapolation and requires two important steps to consider: i) Define the linear equation of each song. ii) Find the points where the lines intersect.
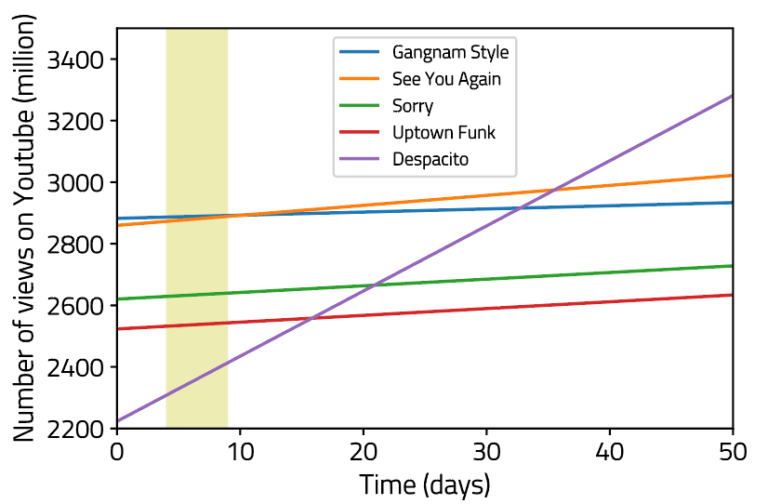
The results are given in Fig. 2, where we have extrapolated the data from Fig. 1 (yellow area). To find the linear equations we have used the method of least squares. A full explanation of the analysis appears in the following tutorial:
And the associated code is given in my repository @Github. To delve into the subject it is important to know that the linear equation with one variable is given by $y = m x + b$. Then, knowing $m$ and $b$, we can get the value of $y$ (total number of views) for each value of $x$ (time expressed in days). In this sense, e.g., if Despacito ($d$) and See You Again ($s$) linear equations are given by: $$y_d = m_d x + b_d,$$ $$y_s = m_s x + b_s.$$ To determine the point where they intersect, the following relationship must be fulfilled, $y_d = y_s$, or, $m_d x + b_d = m_s x + b_s$. This relationship is part of what we call linear extrapolation, because we are assuming that the future behavior of the songs will continue to follow a linear trend. Solving the equation we obtain: $$x = \frac{b_s - b_d}{m_d - m_s}.$$ As you can see, it is enough to know $m$ and $b$ to obtain the intersection point. Further details are given in the aformentioned tutorial. We proceed now to show the final results:
You must bear in mind that the results given in Table II present a margin of error because we are assuming a linear behavior in the future based on data given only from July 4th to July 9th. In general, a prediction model considers variables as stochastic, that is, the variables are random (non-deterministic) and are exposed to external shocks that can change the “normal” course of history. For example, the number of views is a random variable, because I do not know exactly the number of people who will see the video-clip the next day, but I can dare to give a number with a certain degree of significance, that is, my prediction is subjected to a margin of error depending on the model I use. In the example given in Fig. 2, where we have applied linear extrapolation considering the least squares method, we have omitted various exogenous factors that affect the number of views, such as people's routine, internet access, the diminishing marginal utility of each individual (that is, the fact that songs sooner or later become tiresome), among other factors. How long does it take for someone to get sick of his/her favorite song? We don't know, each song behaves differently. We just know that at some point we get tired of them. If we want a slightly more sophisticated model where we can use all these variables, statistical concepts such as Bayesian theory and time series are necessary. That's right, it sounds complicated and that is why it is something that we will see better in another opportunity.
Here we will focus on understanding the limitations of our prediction model, for this we will focus on Despacito. This song was released on January 12th, 2017, 97 days later it reached one billion views on YouTube, which means that on average it accumulated 10 million views per day from January 12th to April 20th. With these data, can we infer what will happen next? Not necessarily, because the behavior is stochastic, then there are exogenous factors that can alter the trends. One of these factors has a name: Justin Bieber. On April 17th, he altered the probabilistic data with his Despacito remix. This alteration would come to be a positive shock to the number of views, since Justin Bieber, due to the number of fans he has in the world, transformed the probabilistic growth of Despacito, who expanded in the Anglo-Saxon world. On June 20th, Despacito reached 2 billion views, that is, in 60 days (from April 20th to June 20th) it accumulated an average of 16.7 million views per day. Here, I want you to pay attention to these values, because if we would have considered the linear adjustment with the data given in the first months of the year, we would have obtained as a forecast a continuous growth of 10 million views per day, but in the following months it was 16.7 million, In other words, linear extrapolation would have given us totally incorrect results. And what happened after June 20th? The following histogram shows us.
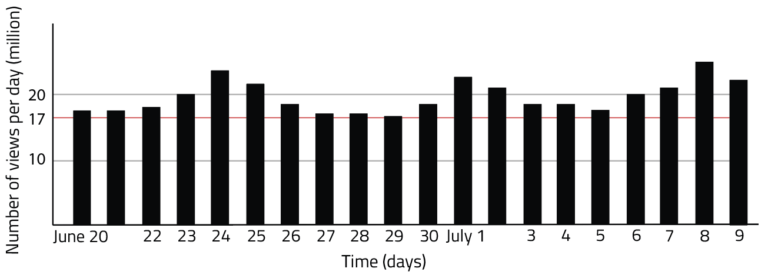
Although the song has been around for a long time, Despacito, in the months of June and July is enjoying its highest peaks, reaching an average of 21 million views per day, with peaks exceeding 24 million on weekends. Will Despacito be able to exceed these values in the month of August? Probably not. Although the calculations are not shown here so as not to make the discussion cumbersome, it can be estimated that the song has reached stable values and in the coming weeks it will decline "slowly" and "little by little"; therefore, it is feasible to assume that the forecasts given in Table II will not be fully met and there will eventually be a lag of a few days. Let's further elaborate this analysis with the following data:
In Table III we are showing the highest values that the songs can have on a day of July, which corresponds to weekend values. Detaching ourselves from external factors, we can predict that See You Again will drop to 2.3 million views per day in the future due to the fact that these are the stable values of Sorry and Uptown Funk, which makes it, anyways, the most viewed video on Youtube in the month of July. We have previously said that Despacito will surpass See You Again on August 4th; however, due to the margin of error, it is better to say that it will become the video with the most views on Youtube between the first and second week of August.
The pending question would be, on what date will Despacito reach 3 billion views? If we use the linear equation plotted in Fig. 2, we obtain that it will achieve this on August 5th, 2017. Therefore, considering the margin of error, we reach the same conclusion, i.e., it will reach 3 billion views between the first and second week of August. The final results, which were fulfilled correctly, are described in the article: "Integral calculus to predict the future of Despacito."
Views: 1 Github
Related Articles


Notifications
Receive the new articles in your email
Other Articles

The most efficient method to learn English: Cultural exchange
stats con chris

Basic plugins to improve your WordPress website
stats con chris


Football: bookmaker versus the stock market
stats con chris