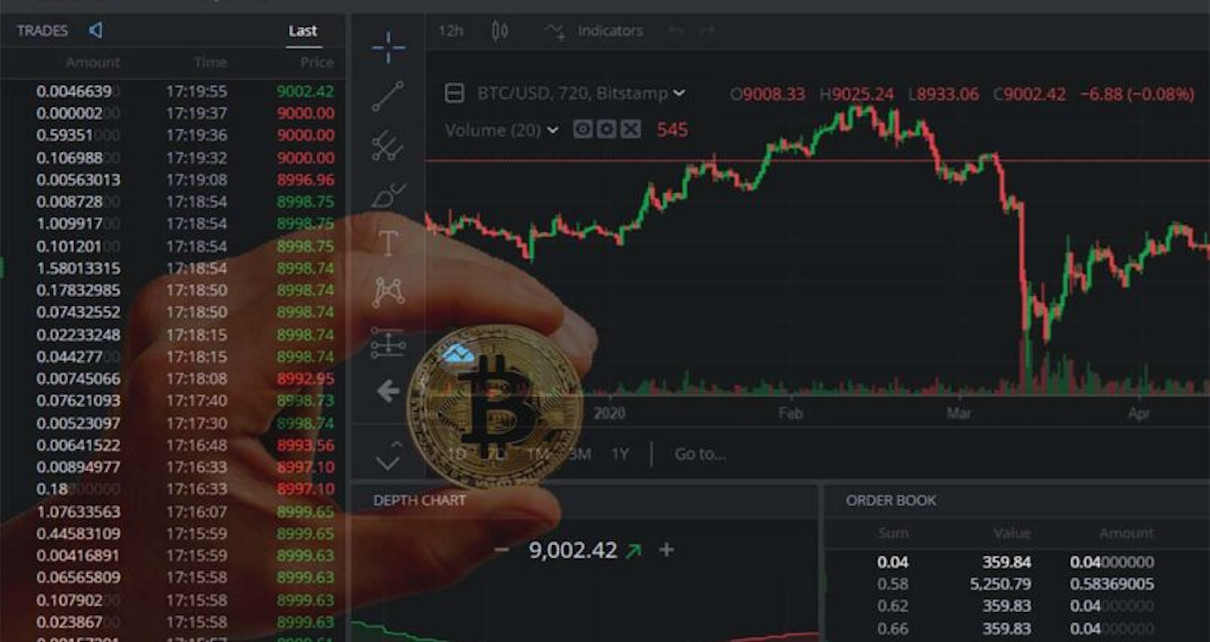
Considering the Bitstamp exchange platform, we show the math behind the trading fees and discuss the minimum growth needed to start making profits. The calculations were developed in JavaScript.
Considering the Bitstamp exchange platform, we show the math behind the trading fees and discuss the minimum growth needed to start making profits. The calculations were developed in JavaScript.
You're probably here because you've heard of bitcoins, altcoins, and the blockchain. If not, I invite you to read: "The origin of bitcoins. A complete explanation for beginners," because here we will go straight to the point, we are going to invest in cryptocurrencies and we are going to make money with it. There are three pillars to achieve this, these are: i) Statistical data. ii) News of the world. iii) Trading fees. In this article we focus on the third one, because the cryptocurrency market, unlike the forex and the stock market, offers higher volatility; therefore, the fees play a very important role when it comes to making profits. We also provide an introduction to statistical data, which is covered in more depth in a later article.
A summary of this article with some extra info appears in the following video:
Before starting, it is worth mentioning that the first step to invest in cryptocurrencies is to register on a platform that offers them. There are several and I leave it to your discretion to choose the one that suits you best. In this article I will consider Bitstamp for two specific reasons: i) It allows SEPA (Single Euro Payment Area) transactions, which means that transferring money from a European bank to a Bitstamp account does not incur any fees; therefore, if you are in Europe this is a good option for you. ii) It is an intuitive and easy to use platform. It does not have many options, which means that it is suitable for beginners. Details about how to open a Bitstamp account can be easily found on the internet; therefore, we skip this step here and assume that you already have a Bistamp (or any other) account.
First of all, how does Bitstamp make money? It makes money by charging us a trading fee whenever we buy or sell cryptocurrencies, this fee is in the range of 0% to 0.5%, depending on the amount of money you invest. As the amount increases, the fees decrease. More details are found at bitstamp.net. Therefore, when investing we must keep this in mind to know exactly how much we could earn. In the following form we can calculate how much we can earn with a particular investment, for this we have to type the buying price of the cryptocurrency ($P_c$), the selling price ($P_v$), the quantity ($Q$), the buying fee ($I_c$) and the selling fee ($I_v$). In most platforms $I_c \neq I_v$.
Calculate the profit
As an example in the form above we could consider the purchase of 2 bitcoins at the price of 10K USD with buying and selling fees of 0.5%, and a selling price of 11K USD. To calculate the profit, we just write 10000 in $P_b$, 11000 in $P_s$, 0.5 in $I_b$ and $I_s$, and 2 in $Q$. Then, by clicking on "calculate" we have the answer, which should give us 1790, that is, buying 2 bitcoins at 10K USD and selling them at 11K USD would give us a net profit of 1,790 USD. The code to calculate this was written in JavaScript and can be downloaded from my repository @Github. In case you want to understand the math behind this form, what we have done is the following:
$$ \begin{align} T_b &= P_b \times Q \times (1 + \frac{I_b}{100}), \tag 1 \\ T_s &= P_s \times Q \times (1 - \frac{I_s}{100}), \tag 2 \\ G &= T_s- T_b. \tag 3 \end{align} $$$T_b$ is the money invested in the purchase, $T_s$ is the money received from the sale and $G$ is the profit. If we consider $G=0$, we get the price increase for which we get our money back with zero profit. In this case the formula reduces to:
$$ \Delta_0 = P_b \frac{(I_s + I_b )}{100 - I_s}, \tag 4 $$where $\Delta_0 = P_s - P_b$ is the increase in price. Note that in this last expression the value does not depend on the quantity, it only depends on the buying price and the trading fees of the exchange platform, that is, it does not matter if we buy, e.g., 0.15 or 2 bitcoins, $\Delta_0$ will be the same. In the following form we calculate the minimum growth needed to start making profits:
Calculate the minimum growth to start winning:
As an example, in the form above you could consider the purchase of bitcoins at a buying price of 6,000 USD. Assuming that the trading fees are 0.5%, then we would get 60.3 as the minimal growth, which means that the price must increase to 6,060.3 USD to get back the money invested. If we do the same for another cryptocurrency whose buying price is, e.g., 10 USD, we would obtain 0.1 as a minimum growth, that is, it must grow up to 10.1 USD to recover our investment. You may be thinking: "why do we need to recover first?" This is due to the fact that we are losing money with the trading fees and the first step is to clear this lost. Note that in the first case we needed 60.3 USD, while in the second one 0.1 USD. It seems that the minimum growth is smaller as the buying price becomes smaller; however, let’s not be fooled, because what matters here is the percentage values. If $P_b$ represents 100%, How much does $Δ_0$ represent? The answer is given by,
$$ \Delta_0(\%) = 100 \times \frac{(I_v + I_c )}{100 - I_v}. \tag 5 $$As you can see, the percentage value does not depend on the buying price, that is, the minimum growth needed to recover our money is the same for all cryptocurrencies in the world and only depends on the trading fees. What is this minimum growth? For trading fees of 0.5% we get 1%. Therefore, in this particular case, any cryptocurrency that grows more than 1% will start giving us profits, so all we have to do is to check the percentage variations of the cryptocurrencies. A fast method to find out this is by checking the data given in coinmarketcap.com, where you can get a table similar to the following one:
| Cryptocurrency | Symbol | Supply | Price (USD) | Market cap (USD) | Volume 24h (USD) | 1h (%) | 24h (%) | 7d (%) | |
|---|---|---|---|---|---|---|---|---|---|
| 1 | BTC | 17,332,275 | 6473.25 | 112,196,227,872 | 3,562,322,297 | -0.24 | 0.28 | 2.99 | |
| 2 | ETH | 102,689,256 | 205.36 | 21,088,049,625 | 1,278,706,804 | -0.24 | 0.84 | 2.73 | |
| 3 | XRP | 39,997,634,397 | 0.457949 | 18,316,870,080 | 301,548,040 | -0.35 | 1.23 | 9.27 | |
| 4 | BCH | 17,412,575 | 441.65 | 7,690,268,083 | 273,387,093 | -0.42 | 1.07 | -0.99 | |
| 5 | EOS | 906,245,118 | 5.38 | 4,871,211,549 | 383,165,882 | -0.41 | 0.64 | 2.72 | |
| 6 | XLM | 18,893,406,838 | 0.247268 | 4,671,737,331 | 61,143,517 | -0.42 | 3.67 | 14.09 | |
| 7 | LTC | 58,805,852 | 53.06 | 3,120,180,906 | 258,745,013 | -0.18 | -0.02 | -1.01 | |
| 8 | USDT | 2,076,421,736 | 0.98 | 2,034,898,202 | 2,356,445,803 | -0.09 | -0.33 | -1.03 | |
| 9 | ADA | 25,927,070,538 | 0.076588 | 1,985,710,329 | 21,732,522 | -0.43 | 2.01 | 4.22 | |
| 10 | XMR | 16,496,695 | 103.86 | 1,713,343,113 | 18,575,443 | 0.00 | -0.04 | 1.59 |
You will encounter Table I in different platforms; therefore, it is important to know what they mean: i) The supply is the amount of coins that are in circulation. For example, for the given date with exact time, there are 17 million 332 thousand 275 bitcoins circulating. This number will increase over the years to the value of 21 million because it is the maximum number given by the creator. ii) The price is the unit value of the currency. Keep in mind that this value is not constant because there are buyers and sellers that make the price fluctuate. iii) Market capitalization is the product of supply times price and represents the total value of all coins in circulation. In Table I we show the top 10 coins with the highest market capitalization, where bitcoin occupies the first position and monero the tenth. iv) The 24h volume tells us how much money is moved in one day, that is, it is the monetary sum of all the given successful transactions, where a transaction is successful if the purchase or sale is completed. v) Finally, in the last three columns we have the percentage variation of the price in the last hour, the last 24 hours and the last 7 days. These data are the most important because they tell us, which cryptocurrencies have the potential to give us profits. For example, for the given values, what conclusions do we get? The first one is that the percentage variation in the last hour has been very low, remember that to start making profits with trading fees of 0.5%, the price of the cryptocurrency must grow (or at least oscillate) above 1%. The second conclusion is that the growth of bitcoins in the last 24 hours has also been low, it only grew by 0.28%, which means that if we had bought bitcoins the day before, 24 hours later we would still be at a lost. Finally, the third conclusion appears by looking at the 7 days column, we see that bitcoins reached a growth of 2.99%, this value is already higher than 1%; however, it is small compared to the growth of XRP (+9.27%) and Stellar (14.09%), that is, if instead of bitcoins we would have bought the latter, then we would have had greater profits. Of course, these data belong to the past, to make an investment we must predict how they will behave in the future. For this, there are 2 basic rules: i) It is very likely that a cryptocurrency that exhibits high oscillations in its price, will continue to do so in the near future. ii) If the price of the cryptocurrency has fallen sharply in the last few days, it is very likely that it will recover in the coming days. If we take these basic rules into consideration, we will notice that it is worth keeping an eye on XRP and Stellar because they are the ones that have had the greatest oscillations; however, both have grown in recent days, if on the contrary they would have fallen, they would become strong investment options. I invite you to watch the video attached to this article where, in real time, we put the basic rules into practice.
To conclude, it is worth mentioning that although in Table I we see the percentage variation in one hour, sometimes it is important to check variations in 30 minutes, in 15 minutes, in 5 minutes and even in one minute. But for that, one must see the price vs time charts, something that requires understanding the concept of Japanese candlesticks. A full description of these candles is given in the article: "Japanese candlesticks. A complete explanation for beginners." I invite you to read it and then I can assure you that you will be ready to make your first investment.
Views: 1 Github
Related Articles


Notifications
Receive the new articles in your email
Other Articles

Football: bookmaker versus the stock market
stats con chris


Linear extrapolation to predict the future of Despacito
stats con chris

The most efficient method to learn English: Cultural exchange
stats con chris