How to make a profit exchanging Peruvian soles for euros?
There are three important points to consider: i) statistical data, ii) news, and iii) buy & sell values. Let's start with the statistical data. The first point that you must know before exchanging your local currency for euros is its historical exchange rate. Nowadays this information is easy to get, there are countless pages on the internet that gives you such data. In this article, I have used data from investing.com.
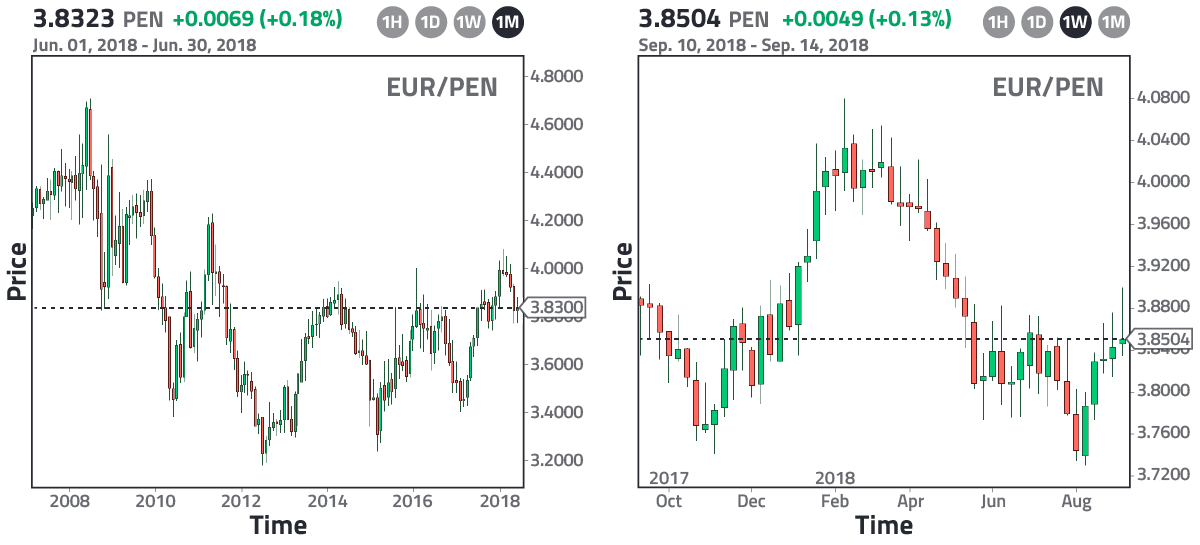
In Fig. 1 we see the EUR/PEN exchange rate from 2008 to 2018 (left) and from October 2017 to August 2018 (right). Both charts are plotted considering one-month and one-week Japanese candlesticks, respectively. To understand the concept of Japanese candlesticks, I invite you to read the following article: "Japanese candlesticks. A complete explanation for beginners." Let's focus first on the left image. The maximum value of the euro was 4.5146 soles and it happened in 2008. On that date, having 1 euro in your pocket was equivalent to having 4.5146 soles. This value could be considered the upper bound of the euro; however, from a statistical point of view, it is better to set the upper bound as the average of all the local maxima over the last 10 years. This gives us an approximate value of 3.9 soles; therefore, this value will be the actual upper bound. Similarly, the lower bound is given by the average of all the local minima, thus we obtain a value of 3.5 soles. What do these values mean? It means that, on average, the euro has oscillated between 3.5 and 3.9 soles within the last 10 years, but how can we make a profit with this information? To understand it, now let's focus on the left image and let's assume that we are in January 2018. As you can see, in that month the euro has crossed our upper bound of 3.9 soles; therefore, it is feasible to assume that it will not grow much more, or in other words, it will soon be devalued. What do we do? We sell euros! Let's say that we have 1,000 euros in our pocket, then we sell them and receive 3,900 soles in return. What do we do next? We wait for the exchange rate to approach the lower bound. In August 2018 we can see that the EUR/PEN exchange rate has decreased to 3.74. Our lower bound is at 3.5, so we can wait or just buy euros in August for fast gains. In this case, because we see a recovery to 3.8 in the following days, we opt for the latter. We buy 1,000 euros and for that, we pay 3,800 soles, 100 soles less than what we received in January. At the end of August in our pockets, we will have the initial 1,000 euros plus 100 soles in profits that appeared out of thin air.
Is it enough to know the exchange rates to make money? Of course not! Let us now study the second point: The news. What we need to ask ourselves is why the exchange rate decreases or increases. It depends on supply and demand, concepts that are explained in the third video given on the first page. Here we omit it because we focus on specific events. What you really need to keep in mind is that whatever happens in a country, greatly affects its currency, therefore, it is important to constantly check the news. In the case of the euro, why did the currency decrease against the Peruvian sol in the first half of 2018? i) Because there was inflation in Europe and when there is inflation, the currency is meant to lose its value. ii) Peru remained stable due to its growing economy and political stability. How would you have benefited from knowing this information? Let's say that in January 2018 you see that the euro crosses the upper bound of 3.9 soles. Statistically speaking, you would have sold euros, but if the news would have told you that the European economy was doing well, then you would not have done it because you would have been convinced that it would grow a bit more. It was in March 2018, when the euro was worth 4.0 soles, that the news began to talk about a latent European inflation, therefore, in March you would have sold your euros. All you had to do afterward was to keep an eye on the news to find out when you could buy them back. Statistically, you were aware that the lower bound was 3.5; however, by August 2018, the news reported that the European problems were already improving, that is, you would have bought euros in that month at the value of 3.74 soles regardless that it did not reach the lower bound. If we assume a sale of 1,000 euros at a value of 4.0 and a buyback at a value of 3.74, then the profit would have been (4.0-3.74) x 1,000 = 260 soles. As you can see, unlike having only considered statistical data, when taking into account the news, the profits are bigger. Although the analysis seems exhaustive, today thanks to the internet we can find many sources that talk about it and forecast the exchange rates of the currencies; therefore, investigating the subject is not a difficult task, on the contrary, it helps you a lot because it allows you to understand better how the world works.
Once we define the upper and lower bounds of the currency and pay attention to the news, we have to make an adjustment. For this, we must go to an agency that offers a currency exchange service and collect information about the buying and selling prices. You should preferably choose an agency close to your home in order to invest less time and energy in it. Here is the data that I obtained for the Peruvian sol using Argenper:
As you can see in Table I, the data was collected throughout the year 2018 on random dates. In the fourth column we have the difference between the selling price and the buying price (Δ), and in the fifth column, we have placed the values of Fig. 1 (investing.com). Unlike the latter, an exchange currency agency presents two values for the same date, a buying, and a selling price, in order to obtain profits. Let me explain, let's imagine that on August 16th you have 1,000 euros in your pocket and you want to exchange them for soles, to do so you go to the exchange currency agency and they will give you 3,720 soles because 3.72 is their buying price (in orange in Table I). How does the agency make a profit from this transaction? They are not going to make any profit until they sell your 1,000 euros to someone else. Let's imagine that person B wants euros on that same day, then he or she will go to the agency and will no longer pay 3,720 but instead 3,850 soles because 3.85 is the selling price. At that moment, the agency makes 3,850 - 3,720 = 130 soles in profits, and just by circulating 1,000 euros. Isn't it a profitable business? It is, however, as you may guess, you can also make money circulating 1,000 euros.
In our first example (considering the data from investing.com), we sold 1,000 euros in the month of March at a price of 4.0 soles. Let's specify that it was on 03/29 (in light blue in Table I). Although investing.com shows a value of 4.0, the exchange currency agency will give us 3,970 soles because 3.97 is its buying price. Then we bought 1,000 euros in the month of August. Let's specify that it was on 08/16 (in orange in Table I). Although investing.com shows a value of 3.74, we will pay the agency 3,850 soles because 3.85 is its selling price. In the end, we make a profit of 3,970 - 3,850 = 120 soles, which is much less than 4,000 - 3,740 = 260 soles (the profit made using investing.com data). In the real world, we will always encounter these buying and selling prices, therefore our profits will always be affected. How much? It all depends on the value of Δ. If on a given day the buying price is x, then the selling price will be x + Δ. Considering Table I, we can generate the following table for the date 03/29:
In Table II, the data in the first row correspond to the buying and selling prices of Argenper. From them, we obtain Δ and define the neutral value as the arithmetic mean, i.e., (sell + buy)/2. In the second row we start by defining the value of investing.com as the neutral value and considering the same Δ we calculate the buy and sell prices, i.e., buy = neutral - Δ/2 and sell = neutral + Δ/2. What can we conclude from this? Well, if we choose the value of investing.com and from it, we formulate possible buying and selling prices, these will not coincide with the ones given by the agency; nonetheless, these prices will be close to the agency prices and therefore they can be helpful to get an idea of potential profitable dates. Let me explain, to buy back our 1,000 euros after selling them to Argenper on 03/29, we cannot do it on the same day because the selling price of Argenper is above the price at which we sold, that is, we would have to pay 4,150 soles to recover the 1,000 euros that we initially sold for 3,970 soles. This would leave us at a loss. Keep in mind that the selling price of the agency is the one we use to buy and the buying price is the one we use to sell them, it may be confusing but is a matter of what is considered the reference point. To not be at a loss, what we must do is wait for the buying price of 03/29 to be equivalent to the selling price of a later day, that is, the currency must depreciate in Δ soles to just recover our money. This occurs on 05/05 (in red in Table I). Therefore, for that date, we would have the following table:
In Table III, for investing.com we have kept the same Δ as on 03/29. Why? Because we are assuming that we went to the exchange currency agency in March and we did not go back, that is, in our reasoning the Δ did not change. However, as we can see in Table I, the agency can alter the value of Δ at will and it is something that we should keep in mind. Curiously, in this case, it is enough to know the neutral value of investing.com to deduce that on 05/05 we could already be recovering those 1,000 euros because in both cases, Argenper and investing.com, the selling price is greater than or equal to 3.97 (even when we have used different Δs). With this, I want to tell you that it is not so important to constantly check the exchange rate in the agency in order to know the right time to make profits, because, as you can see, the neutral value, given by investing.com in this case, gives us a similar output. You are free to use any other platform on the internet to get the neutral value. In the end, you just need it to calculate, with simple mathematics, the possible buying and selling prices at your agency. Of course, it is better to have a rough idea of the Δ value of the agency. For example, in Table I we can obtain the average of all the Δs given by Argenper and deduce that an optimal value to consider would be Δ = 0.15.
Forecast to buy and sell euros
To finish, let's predict when we should buy and sell euros to make some profits. We showed that the lower bound is 3.5 and the upper bound is 3.9 (values from investing.com). These values are very important because every time the euro approaches them, it will be an ideal time to buy and sell, respectively. Keep in mind that these bounds will hold for a long time until the next global crisis, that is, regardless of the date that you are reading this article, you will be able to use the data given here to make a profit, e.g., in our analysis Δ = 0.15. So, if your agency has a similar Δ you can proceed to buy at 3.6 (value of investing.com), which implies that its buying price is 3.6 - Δ/2 = 3.525 and its selling price is 3.6 + Δ/2 = 3.675, that is, you will buy 1,000 euros paying 3,675 soles and then you will wait for the neutral price to rise to 3.8 (value of investing.com). In your agency, this will be reflected with a buying price of 3.725 and a selling price of 3.875. You will proceed then to sell your 1,000 euros for 3,725 soles obtaining a profit of 3,725 - 3,675 = 50 soles. You can repeat this process many times. Your profits will be higher if you find an exchange currency agency with a Δ lower than 0.15. If you do, you could even lower your risk considering your neutral values as the agency values, that is, buying at 3.675 and selling at 3.725 (values of investing.com). Eventually, in the agency, this would give you a loss with the given Δ, but with a smaller one, you could still profit from the difference. What I propose to you now is, to check the EUR/PEN exchange rate, what can you say about this rate in the last months and in the last years? What can you tell me about the bounds? If the pattern continues, it may be the right time to buy or sell. And I repeat, in the event of a global crisis, the data given here will no longer be useful because after a crisis new bounds have to be defined. An example is given in the article: "How to exchange currencies during a global crisis." The final advice that I can give you is: "Be patient, currencies always oscillate, but sometimes you have to wait a lot until you start making profits."
Views: 1
Related Articles


Notifications
Receive the new articles in your email
Other Articles


The least squares method with Despacito
stats con chris


Python: Pandas DataFrame data manipulation
joushe info