Two-color candles
They are the most common; therefore, you will find them in every investment platform. Below I show you the two types of candlesticks, or candles for short:
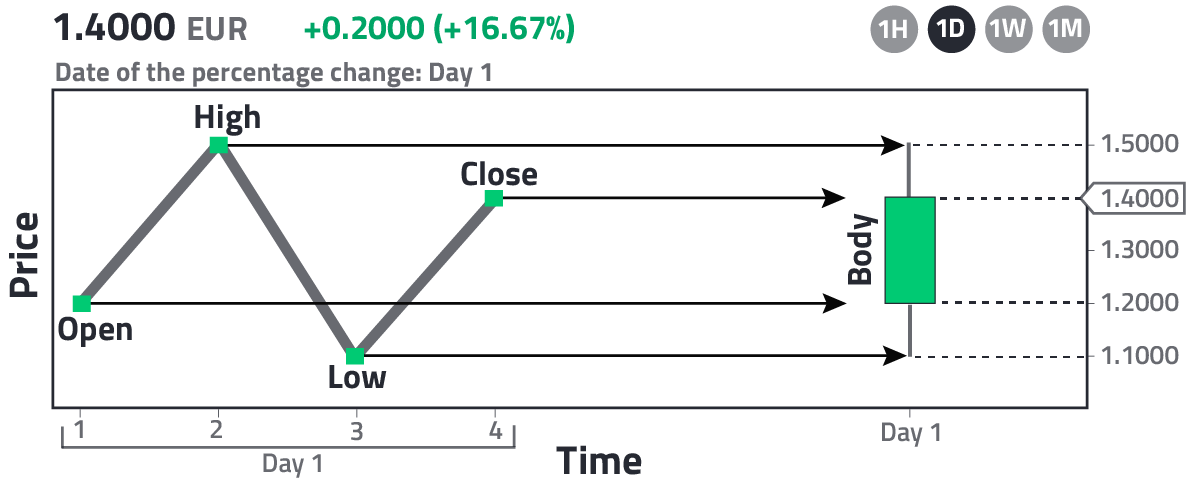
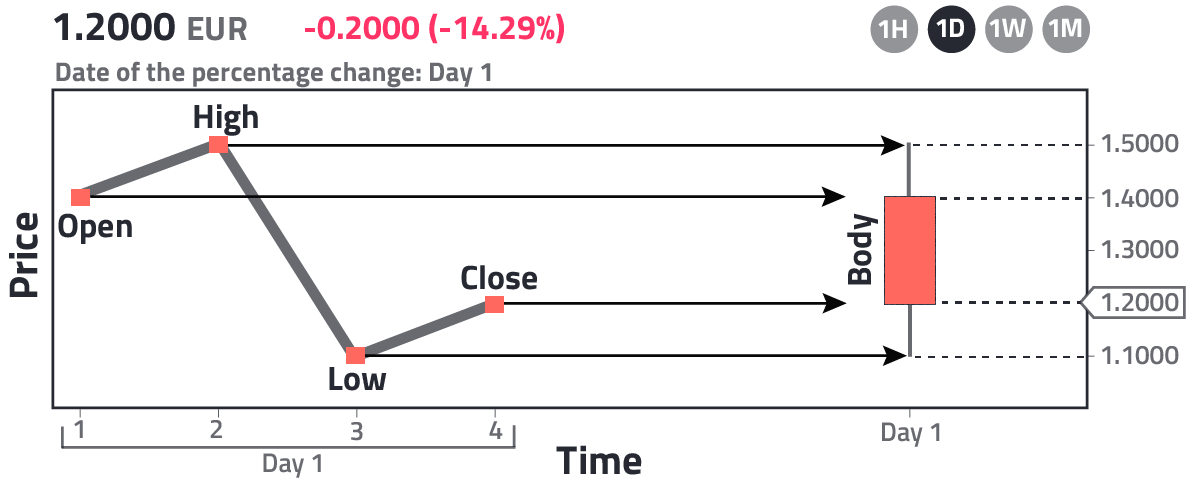
In Fig. 1 we have the up candle and in Fig. 2 the down candle. As you can see, it is colored depending on whether the price of the asset increased or decreased over time. In this case, the green (red) color indicates that the price increased (decreased), that is, the opening price is lower (higher) than the closing price; however, although this is the convention in the West, you should keep in mind that in East Asia the colors are inverted, that is, it is colored red (green) when the opening price is lower (higher) than the closing price. To check this color convention difference, I invite you to read the article: "Differences between the stock exchanges of Japan and the United States." Figs. 1 and 2 are given considering the template used by nepy.pe to plot its charts. In this example, the candles are one day long and we have only drawn the candle for day 1. Each candle has 4 important times. Time 1 is the opening time, time 4 is the closing time, and times 2 and 3 represent intermediate points where the asset took maximum and minimum values. As you can see, the body of the candle is the rectangle defined by the opening and closing prices, while the maximum and minimum values are defined by drawing linear extensions to the body of the candle; therefore, the candle gives us a summary of how the price of an asset has fluctuated in a given interval. In Figs. 1 and 2, the percentage change is calculated as (close-open)/open x 100. In certain cases, one wishes to calculate the percentage change for a group of candles. If so, the opening price of the first candle and the closing price of the last candle are considered. In the given template, the price that appears in the header is the closing price of the last candle of the chart, in this case, as there is only one candle, it corresponds to the closing price of such candle, i.e., 1.4 EUR for the up candle and 1.2 EUR for the down candle.
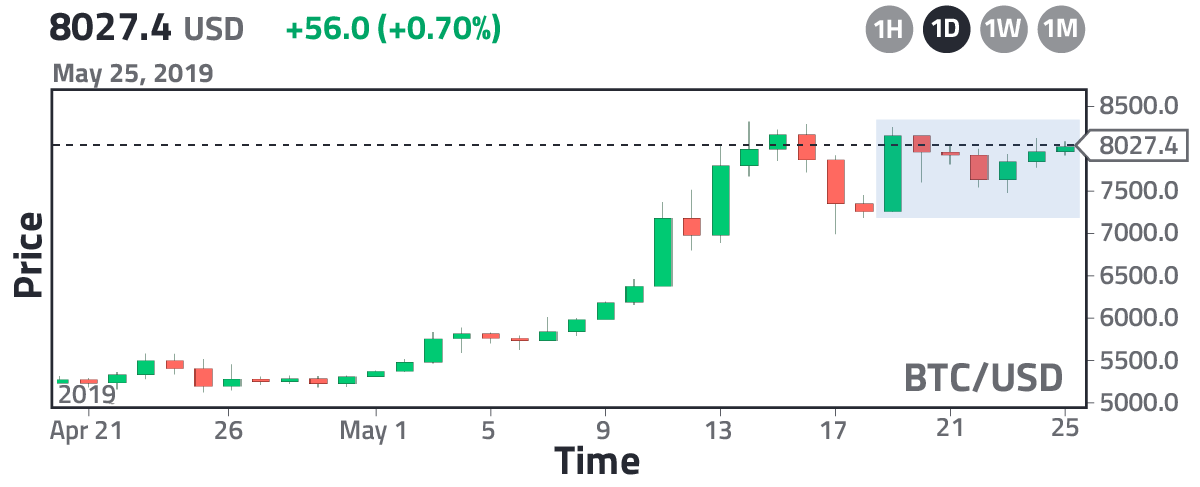
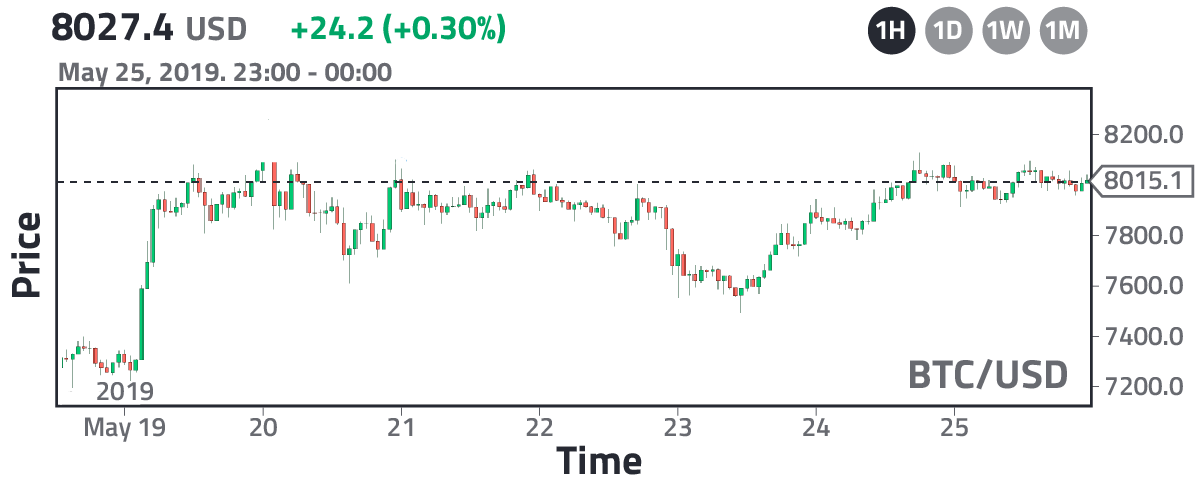
To better understand the concept of Japanese candlesticks, let's consider the fluctuation of bitcoins and let's choose two intervals of time for each candle, one-day and one-hour. The former is given in Fig. 3, where we see that each candle has an interval of 24 hours; therefore, for the month of May 2019, there will be at most 31 candles (one for each day). The latter is given in Fig. 4, where each candle is one hour long, so for each day there will be 24 candles. You can see these differences comparing Figs. 3 and 4, where Fig. 4 corresponds to the region given by the blue box in Fig. 3, that is, it corresponds to the period: May 19th to 25th, 2019. Clearly, Fig. 4 gives us more detailed information about what happened in that period, for example, it is thanks to Fig.4 that we know that the dramatic growth of bitcoins on May 19th happened in the first 4 hours.
An important fact to note is that the cryptocurrency market is one that works 24 hours a day and 7 days a week. It never rests, and because of this it shows a continuous candlestick pattern, what do I mean by this? To understand it, let's now see the price chart of an asset in the stock market. As an example, let's consider Juventus F.C., listed on the Milan Stock Exchange:
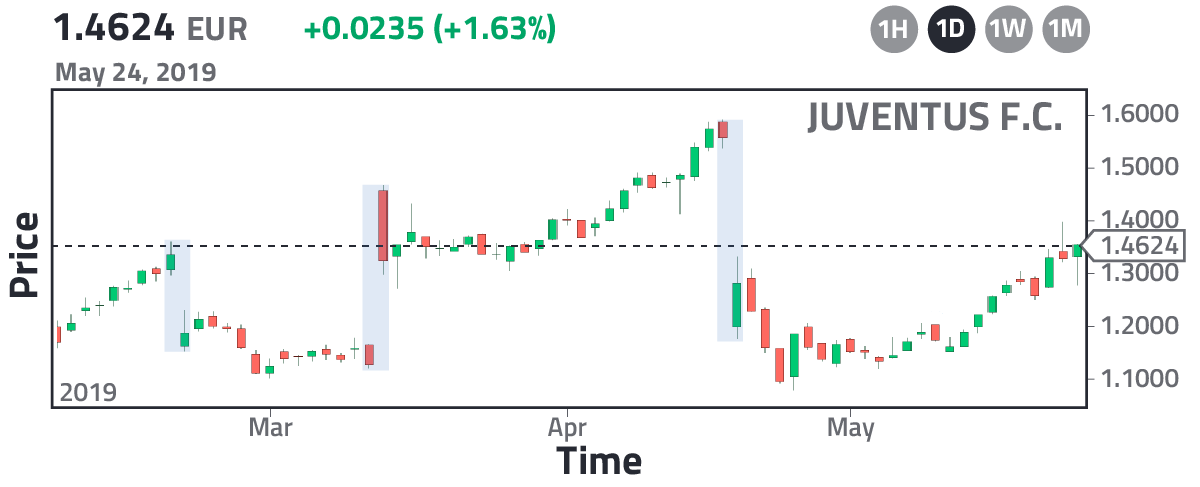
The Milan Stock Exchange opens at 9:00 AM and closes at 5:30 PM, local time. That is, the one-day candle is not equal to 24 hours but, in this particular case, to 8 and a half hours. Each stock exchange is different so keep in mind that they may have different opening times. Although there is an opening time, there is the option to buy or sell shares before the market opens, and it is precisely in this pre-interval of time, called the pre-market, that the price of the share can fluctuate strongly; however, is not reflected in the candlestick pattern because the candle only shows the official time, so as you can see in Fig. 5 with Juventus shares, there are 3 dates in which Juventus had a strong fluctuation before the market opened, giving rise to a discontinuity in the candlestick pattern (blue boxes in Fig. 5). In the cryptocurrency market we will never encounter a discontinuity because there is no "pre-market" as such, keep in mind that the cryptocurrency market operates 24 hours a day. You may be wondering: Why did Juventus have a sharp fluctuation on those dates? The answer is out of the scope of this article, but if you are interested, you can find it at: "Football: bookmaker versus the stock market."
You may be asking yourself: "Are these candlesticks actually helpful?" A set of candles can give us an idea of the trend or a change in the trend of the price of an asset, for example, in Fig. 3 we see a bullish trend of bitcoins because most candles are green. To determine a change in the trend there are various patterns that have been established through statistical studies. One of the most common patterns that appear in any market is given in Fig. 6:
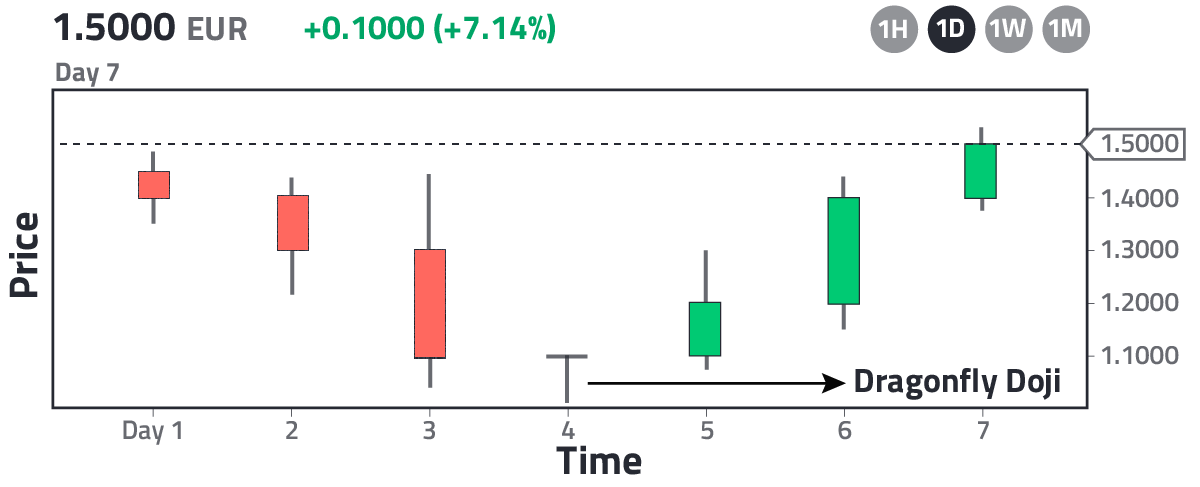
When the low point of a set of candles takes the shape of a dragonfly (opening ≈ closing ≈ maximum), it is called a Dragonfly Doji and is a strong indicator of a trend reversal, that is, if you encounter an asset that is forming a candlestick pattern similar to the one in Fig. 6, you can proceed to buy the asset at time = 6 because the probability is high that it won't fall again; consequently, candlesticks are really helpful, indeed... With experience you will be able to memorize various patterns that identify a change in trend, these are registered on various websites and therefore we skip the list of patterns here. Now let's move on to study the six-color candles.
Views: 1
Related Articles


Notifications
Receive the new articles in your email
Other Articles

12 interesting facts about living in the Andes
stats con chris

Send emails using HTML & CSS. Web programming for beginners
stats con chris

Python: Plotting data containing date format
joushe info

PHP algorithm to simulate the FIFA World Cup draw
stats con chris