We explain what dividends are and provide examples considering companies such as Renault, Shell, Capgemini, and Washington Prime Group.
We explain what dividends are and provide examples considering companies such as Renault, Shell, Capgemini, and Washington Prime Group.
A summary of this article with some extra info appears in the following video:
When you buy shares you have the option to make profits by selling them at a higher price. That's great, but there is a high risk behind it, what if the share price doesn't grow over time, then you will end up losing money. However, there is a different method that allows you to have a constant income from your shares, it has a low risk and is known as dividends.
Dividends, in simple words, are tips that companies give you for keeping their shares. These tips are possible because companies distribute their profits. To understand it better, let's see some real examples.
| Company | Shares | Date | Dividend
(EUR) |
Total
(EUR) |
Tax
(EUR) |
Net Income
(EUR) |
|---|---|---|---|---|---|---|
| 13 | 06/07/2019 | 1.7 | 22.1 | 6.62 | 15.48 | |
| 23 | 06/20/2019 | 3.55 | 81.65 | 24.49 | 57.16 | |
| 48 | 06/27/2019 | 0.3531 | 16.95 | 5.97 | 10.98 |
Table I shows a history of my BNP Paribas account in June 2019. As you can see, on June 7th, 20th, and 27th the companies Capgemini, Renault, and Shell, respectively, deposited tips to my account. Let's break down these numbers to give you an idea of how dividends are handled. Take for example Capgemini, which is a French company listed on the Paris Stock Exchange. In this case, for the given date, I had 13 shares in my possession, and for each of them Capgemini gave me 1.7 EUR, that is, a total of 13 × 1.7 = 22.1 EUR in tips; however, as you can see in the last column, I ended up receiving 15.48 EUR because I paid a capital gain tax of 30%. In most countries this tax is between 20% and 30%, that should neither surprise you nor discourage you because even if you don't receive the full amount, you still get paid.
Now let's discuss how and when a company pays dividends. A page that provides this information is, for example, dividendmax.com.
In Table II we show the dividend data of Capgemini for the year 2019. As you can see, the dividend was 1.7 EUR, and it was declared on Feb 14th, 2019, that is, until Feb 13th, investors didn't know the dividend value for that year. The closing date, or Ex-Div date, was on June 5th, while the payment date was on June 7th, that is, if we would have bought the shares on June 5th or after, we would not have received the dividends corresponding to that year. Dividends are only granted if shares are bought before the Ex-Div date. What is interesting is that it doesn't matter when we buy the shares (as long as we buy them before the Ex-Div date). For example, if A would have bought 100 Capgemini shares in January 2019 and B would have bought them on June 4th of the same year (one day before the Ex-Div date), then both would have received the same amount of money on June 7th. But that's not all, B could have easily sold his (her) shares on June 6th and he (she) would have still received the dividends corresponding to that year. Why? Because it doesn't matter what we do with our shares after the Ex-Div date. In this sense, you might be thinking that it would be enough to buy the shares a day before the Ex-Div date and sell them a day later to constantly receive money from the dividends, right? It seems like the perfect plan since there are thousands of companies and therefore thousands of Ex-Div dates distributed in the year... Unfortunately, this won't be possible, but before explaining why, I want to tell you exactly how much money you can make with dividends. To do so, let's consider the following table:
| Company | Frequency | Ex-Div date | Share Price
(EUR) |
Dividend
(EUR) |
Dividend Yield
(%) |
Net Dividend Yield
(%) |
|---|---|---|---|---|---|---|
| Annual | 06/05/2019 | 106 | 1.70 | 1.60 | 1.12 | |
| Annual | 06/18/2019 | 60.5 | 3.55 | 5.87 | 4.11 | |
| Quarterly | 05/16/2019 | 27.5 | 0.3531 | 1.28 | 0.89 |
In Table III we show the dividend information of Capgemini, Renault, and Shell on March 1st, 2019. Let's consider that we bought shares on this specific date at the values given in the fourth column, i.e., we bought Capgemini shares at the value of 106 EUR, Renault shares at the value of 60.5 EUR, and Shell shares at the value of 27.5 EUR. The fifth column shows the dividends that we got for each share. Based on this information, we can compute the dividend yield as (dividend / share price) x 100. For Capgemini, for example, we had (1.7 / 106) × 100 = 1.6%, whereas for Renault we had (3.55 / 60.5) × 100 = 5.87%. We clearly see that Renault offered a higher dividend yield in 2019. But what does it mean? To understand this, let's focus on Renault and consider that two users bought 100 Renault shares on different dates, user A bought them on March 1st, 2019, and user B bought them on May 23rd of the same year. On the latter date, the share price was around ~50 EUR; consequently, B bought shares at a cheaper value compared to A, who did it at the value of 60.5 EUR, see Table III. For B, the dividend yield became (3.55 / 50) × 100 = 7.1%, while for A it was 5.87%. Because both users bought the same amount of shares, then both received the same amount of dividends; however, while A spent 100 x 60.5 = 6,050 EUR, B spent 100 x 50 = 5,000 EUR; therefore, a higher dividend yield means that you are investing less to get the dividends. But that's not all, now let's pay attention to the amount of money that you receive. In 2019, Renault paid in dividends 3.55 EUR per share; however, keep in mind that there is a tax to pay, so the net dividend was in fact 3.55 - 30%(3.55) = 2.49 EUR. If we assume that this value remained constant in time, then every year A and B would have received 100 x 2.49 = 249 EUR, which implies that in 21 years, they would have received 21 x 249 = 5,229 EUR. Notice that B invested 5,000 EUR while A invested 6,050 EUR, then in 21 years B would have recovered all the money invested, while A would still require some extra years to achieve the same. What is important to remark is that in 21 years, both, A and B, would still have their shares with them, so they can sell them and get some extra money besides the dividends. To know the percentage of money invested that it is given back to you on the dividend payment date, we need to calculate the net dividend yield. For A we got (2.49 / 60.5) x 100 = 4.11% and for B we got (2.49 / 50) x 100 = 4.98%. That is, if the dividend remains constant in time, every year, A and B would get back, respectively, 4.11% and 4.98% of their investment. In this sense, a higher (net) dividend yield also tells you how much of your investment you are getting back; therefore, it is always better to buy the share at the lowest possible price and keep it for a long period of time. In this example, I calculated the dividend yield considering the dates at which A and B bought the shares; however, if you check an investment platform, it is usually calculated considering the latest share price in the market. It is like this because it is usually in the present that you decide to buy or not the shares. Moreover, you must bear in mind that the dividend may not remain constant over time. Some companies may increase their dividends, but others may suppress them due to financial struggles. That's why you have to be very careful when you choose a company for its dividends because your plan should be to keep the shares for more than 20 years.
As you may have noticed, dividends are quite powerful in long-term investments because they offer a passive income without paying attention to the share price. What would have happened if you would have invested 1,000,000 EUR in Renault at the price of 50 EUR? You would have received 49,800 EUR net every year, which is equivalent to an average salary in Europe. Therefore, it is plausible to think that you can live from your dividends regardless of what happens to the share price. One important thing to note in Table III is that Shell offers a net dividend yield of 0.89%. It seems small; however, Shell pays dividends every three months, that is, annually, if you don't sell your shares, you would receive 0.89 × 4 = 3.56% of your investment. This is considering the share price of Table III. Keep in mind that although on paper Shell pays dividends every three months, in practice, this may change at any time if the company is under financial struggles. In this article, to ease the discussion, we consider that a quarterly dividend payment is always granted every three months. Consequently, if you focus on long-term investments, Shell becomes a very good option because every three months you could adjust your dividend yield, for example, if the price falls, then you could buy additional shares to increase your dividend yield. In contrast, if the price goes up, you don't want to lower your dividend yield and therefore you won't buy additional shares.
Now, let's go back to our previous discussion: Why it is not possible to buy shares one day before the Ex-Div date and sell them one day after? To understand this, let's take the example of Washington Prime Group (WPG).
WPG is a real estate company that was listed on the Nasdaq Stock Exchange in 2019. As you can see in Table IV, the company paid quarterly dividends. On August 26th, 2019, just 4 days before the Ex-Div date, I bought 340 shares at the price of 3.37 USD. This information can be confirmed in the video, where I show the history of my degiro account. In this article, I directly show the relevant data, which is given in the following table:
| Company | Shares | Date | Dividend
(USD) |
Total
(USD) |
Tax
(USD) |
Net Income
(USD) |
|---|---|---|---|---|---|---|
| 340 | 09/16/2019 | 0.25 | 85 | 25.5 | 59.5 |
On September 16th, 2019, Washington Prime Group paid dividends of 0.25 USD per share. In my case I got 0.25 × 340 = 85 USD in total; however, there is a tax to pay equivalent to 30%, so I ended up receiving the net value of 85 - 25.5 = 59.5 USD. When I bought the shares, the dividend yield was (0.25 / 3.37) x 100 = 7.4%. Paying taxes meant a net dividend yield of 5.2%. If we compare it with Renault, what WPG offered was much better because it was given quarterly. This implies that annually, WPG offered a net dividend yield of 4 × 5.2 = 20.9%, that is, in 5 years you would have recovered 100% of your investment. Seems quite a lot to be true, so what's the catch? The catch is that the real estate sector in the stock market has been plummeting at a constant rate in the last 5 years, so WPG is meant to file for bankruptcy at any moment. If a company that you invested in files for bankruptcy, then all the money that you invested in is gone, so it becomes a very risky investment where you can lose it all. You might be thinking: "If WPG is likely filing for bankruptcy at any moment, then I don't need to keep its shares for 5 years, I just need to buy them one day before the Ex-Div date and sell them one day after." Unluckily, this is not possible because on the Ex-Div date, the share price falls in the same proportion as the dividends are granted. What does it mean? It means that if WPG offered 0.25 USD for each share, then on the closing day, or Ex-Div date, the share price in the market would fall 0.25 USD.
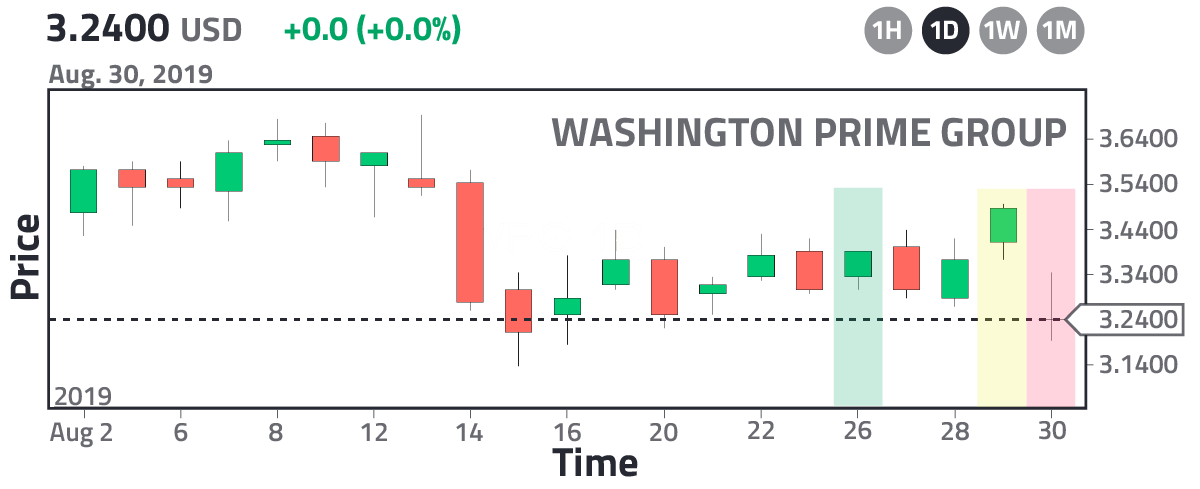
In Fig. 1 we see this behavior. The green rectangle (Aug. 26th), shows the date when I bought the shares. The yellow rectangle (Aug. 29th) shows the last day to buy the shares in order to get the dividends. And the red rectangle (August 30th) shows the Ex-Div date. If you are not familiar with the concept of Japanese candlesticks or the way we handle our charts, I invite you to read the article: "Japanese candlesticks. A complete explanation for beginners."
As shown in Fig. 1, on August 29th, the share price closed at 3.49 USD, and on August 30th it opened at 3.24 USD. It suffered an automatic depreciation of 0.25 USD. This depreciation is what prevents one from buying shares one day before the Ex-Div date and selling them the day after because, for example, if I would have bought 1 share of WPG at the price of 3.49 USD on August 29th, the next day its value would have been 3.24 USD, that is, although I would have received 0.25 USD in dividends, the next day I would be losing them immediately because the share price depreciated in the same proportion.
My case is a bit different, as you can see, I bought WPG shares at 3.37 USD. In the following days, they appreciated up to 3.49 USD, and on the Ex-Div date, they fell to 3.24 USD. This gave me a loss of 3.24 - 3.37 = -0.13 USD per share. However, in dividends, I received 0.25 - 30%(0.25) = 0.175 USD, giving me a net return of 0.175 - 0.13 = 0.045 USD per share...
In this article, I gave you a thorough explanation of what dividends are. I hope with this you have a clearer picture of how to handle your investments.
Afternote: WPG filed for bankruptcy in 2020.
Views: 1
Related Articles


Notifications
Receive the new articles in your email
Other Articles


12 interesting facts about living in the Andes
stats con chris

Python: Plotting data containing date format
joushe info

Make money with margin and leverage on bitcoins. The secret
stats con chris

12 interesting facts about living in Germany
stats con chris