
I share with you the 7 reasons that allowed me to make strong gains with Snapchat and Pinterest. These reasons are part of an introduction to the fundamental analysis. Moreover, I describe the volatility that exists in the stock market when the quarterly results are released.
I share with you the 7 reasons that allowed me to make strong gains with Snapchat and Pinterest. These reasons are part of an introduction to the fundamental analysis. Moreover, I describe the volatility that exists in the stock market when the quarterly results are released.
A summary of this article with some extra info appears in the following video:
In any investment market there are three factors to consider: i) the fundamental analysis, ii) the technical analysis, and iii) the trading fees. In this article we provide a brief introduction to the fundamental analysis and with tangible results we show that it is possible to obtain explosive gains when investing in the stock market. As an example I will consider the events of October 2020, where I opted to tweet every time I bought a share. You can reread those tweets in the following link or follow me to know my future predictions:
Why did I choose October for this experience? Because every 3 months the companies that are listed on the stock market are obliged to release their financial results, that is, are obliged to transparently show to the world their profits and expenses. For example, they have to release the number of products they sold or, in the case of social networks, they have to tell us the number of subscriptions they had. Moreover, they must reveal their future projects and set a plan to manage their investments. These results allow investors to know if a company is growing or not because this information is compared with the previous ones. Usually, the dates where these results are released are given in the months of January, April, July, and October, where April, for example, corresponds to the data from January to March. What does this imply? That if a company has grown in the first three months of the year, these data will only be released in April, and when that happens and the results are great, it will attract more investors because when something grows and there is a solid proof, everyone wants to invest on that. In this sense, the share price will increase due to a larger number of investors, and that is why it is convenient to try to buy shares before they release these results, of course, if these are negative, the share price will collapse, that is the risk that one must face. To better understand this, I'm going to share with you my case, but first I'll summarize the dates that you should keep in mind:
When COVID-19 was officially declared a global pandemic by the end of February 2020, all countries decided to close their borders and limit the production of their resources, that is, on that date it was feasible to assume that in the following months all companies around the world were going to perceive heavy losses and that is why many investors sold their shares and the world's stock markets collapsed. In April, the results of the first quarter, also called Q1, were released. If we pay attention to this, out of the three months corresponding to Q1, only one was hit by the global pandemic: March (in red in Table I), so it was feasible to assume that March would weaken the good results of Q1 and therefore the companies would not reach their financial goals. Indeed, this is what happened, all companies around the world suffered heavy losses, except for one sector that was not affected... the technology sector. If we think about it, it would have been easy to deduce this. A complete analysis is given in the article: "Stock market: How to be a millionaire in times of crisis."
The financial results released in April showed to the world that the technology sector was not affected by the crisis that started in March; however, analysts suggested that it was due to outstanding results in January and February that offset potential losses in the third month. The results of the second quarter, Q2, were much more interesting, keep in mind that they were released in the month of July (see Table I) and reflected a period of global crisis in its entirety since the countries of the world had declared quarantines and closed their borders. Some investors however, took a risk and bought tech companies because they assumed that if they were immune in the month of March, they would also be immune in the following months. These investors were not wrong, technology companies showed colossal gains, to the point that all of them reached new record highs. It was in the third quarter, Q3, that the countries gradually reactivated their economies and therefore many intuited that the results that would be given in October would grant even greater gains. That is why I chose October as the month to make public my investments, predicting, on the way, potential colossal gains. Obviously not all companies were meant to grow, I only focused on the technology ones because I already had a solid proof that they were handling the crisis very well. The ones I focused on are given below:
As you can see in Table II, I bought PayPal on October 09th, Snapchat on October 16th, Amazon on October 20th, and Pinterest on October 22nd. As of the date I wrote this article (December 29th, 2020), the earnings obtained were as follows:
As we can see in Table III, the shares of the companies in which I invested had a dramatic growth, except for Amazon, whose share price barely grew one percentage point.
In this article I will tell you the 7 most important reasons why I invested in the companies given in Table III. To make it short and simple, I'll focus on Snapchat and Pinterest, which belong to the social media category along with Facebook, Twitter, and others.
To better understand the second reason, let's check the percentage variation of Facebook, Twitter, Snapchat, and Pinterest just the day they released their Q3 results:
As I mentioned previously, when the quarterly results are released, if they are very good, they attract more investors and therefore the share price rises sharply; however, if these are very bad, the share price collapses. That is why it is often said that it is not convenient to invest when the quarterly results will be released because there will be strong volatility and you could end up losing a lot of money if the results are adverse, of course if these are very good you will obtain strong profits in one day. In Table IV, the percentage variation corresponds to the difference between the closing price one day before the quarterly results were known and the opening price the following day when these results were released. As you can see, although Facebook showed positive results, it barely grew by 3%, while Snapchat and Pinterest, in contrast, achieved a colossal growth. You will notice that Twitter unlike the others fell -15%. At this point you might think that I was lucky because if I would have invested in Twitter I would have made heavy losses. But there are two very important reasons why I didn't:
So far I have given you reasons based on general beliefs, but whether Snapchat or Pinterest would grow depends solely on their financial data. For this reason, to corroborate my beliefs, I went on to the second stage of my investment strategy: "Analyze the data," and precisely these data are part of what we call fundamental analysis, which focuses on determining if the share price of a company makes sense and is in agreement with its net income. In this article we provide a brief introduction to fundamental analysis and therefore, of all the data that may exist to value a company, here we discuss only two. The first one is intrinsic to social networks and is given below:
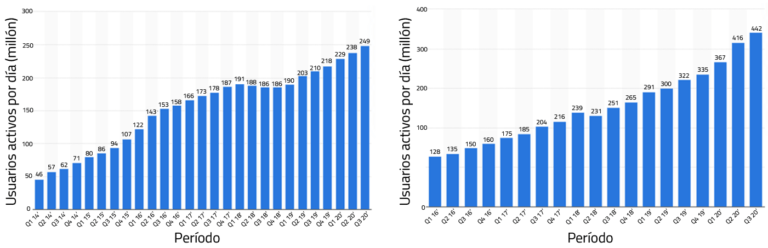
In Fig. 1 we are plotting the number of daily active users (DAU) for each platform, where each bar represents a quarterly period. As we can see, the growth of Snapchat stagnated in 2018 but in 2019 it grew again at a rate similar to that given in 2015. In contrast, Pinterest, since it became a public company, has not stopped growing, and its rate keeps increasing over time. These results contradict what my friends claimed, but the DAU numbers on their own are not enough to make a good investment, we also need to understand them. For example, we need to know why did Snapchat stall in 2018? The answer becomes the fifth reason why I invested in these platforms:
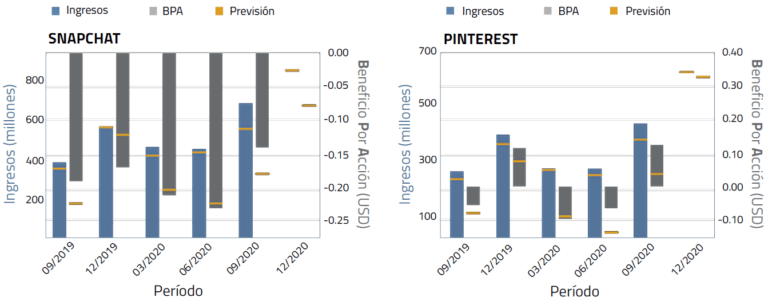
The second data to take into account is the one given in Fig. 2, where we appreciate the revenue of Snapchat and Pinterest in the last 5 quarters (blue bar) and also the earnings per share (grey bar). Here we will focus only on the blue bars, which can be considered the most important data to analyze. The results of Q3-2020 already appear in these charts, denoted with date 09/2020 because Q3 ends in September and its results are released in October. Let's assume that these results aren't there yet, so what I did was to analyze the previous results. As expected, Snapchat's revenue was growing before COVID-19. In March 2020 it fell and by June it stabilized around 400M USD, see Fig. 2 (left). If in Q3 the countries of the world reopened their borders, then it was feasible to assume that the world production would increase. And what does a company do to attract consumers? it advertise its products online. Social networks, in general, make money thanks to the ads they offer on their platforms, therefore, if there is more production in the world, there will be a higher demand for ads and that implies greater revenues for Snapchat. In this sense, it was very easy to deduce that Snapchat was going to grow in the third quarter. However, the fact that a company grows is not enough for its share price to increase, because as you can see in Fig. 2, there is a yellow line that is drawn on the bars. This yellow line is the forecast that financial analysts make about the results that are going to be released, it behaves like a mark that a company needs to pass, or in simple words, it is like an exam, and to pass it you need to be above that line. If the company revenue is above the line then it means that it has really grown more than expected and only then, more investors will come. But investors not only invest in that one company, instead they invest in different companies with similar characteristics because they already have a solid proof that one has grown. These points become the last reasons why I invested in these platforms:
The analysis given here, as you have seen, is not as complex as it seems, in fact not so much data is needed to reach important conclusions. Of course, the data shown here is just the tip of the iceberg, there are more things to analyze, for example, the company expenses, the options, the volumes and the earnings per share, but we will discuss them in a following article that will give us a more advanced understanding of how the fundamental analysis work.
Views: 1
Related Articles


Notifications
Receive the new articles in your email
Other Articles


The origin of bitcoins. A complete explanation for beginners
stats con chris

Basic codes written to improve your WordPress website
stats con chris