Of all the forecasts given between March 2019 and January 2021, we show in how many of them we were right. The article is divided in 3 parts: i) cryptocurrency, ii) forex, and iii) the stock market. The credibility of the forecasts reached 90.5%.
Of all the forecasts given between March 2019 and January 2021, we show in how many of them we were right. The article is divided in 3 parts: i) cryptocurrency, ii) forex, and iii) the stock market. The credibility of the forecasts reached 90.5%.
In the first season, which ran from July 2017 to February 2019, my predictions reached a credibility of 90%. This time, my predictions run from March 2019 to January 2021. These are registered in my Youtube channel, my Twitter account, and the forum of Investing. A summary of this article with some extra info appears in the following video:
Cryptocurrency market
The first market to study is the cryptocurrency market. As you may recall from the first season, I stated that the 2017-2018 period was not a good time to invest in bitcoins; however, this changed on April 15th, 2019, as stated in the comment posted in the forum of Investing:
On that date, the value of bitcoins was around 4,000 USD and I predicted that it was going to reach 6,000 USD. If you check the bitcoin chart on those days, in October, bitcoin was worth more than 8,000 USD.
The following forecasts were registered on my Twitter account:
These predictions were fulfilled. The first two can be easily verified by looking at any bitcoin chart. The third one is explained in the article: "How to hedge or boost your bitcoin gains considering altcoins." Therefore 4 checks, 0 mistakes.
Forex market
The forex market forecasts are registered in the following video:
Exchange currencies in a global crisis.
These are summarized in the following table:
The forecasts listed in Table III are also registered in the article: "How to exchange currencies during a global crisis." I personally consider the first prediction the most impressive because I was able to predict a specific value, which requires a maximum precision. Let's see the following figure to understand this:
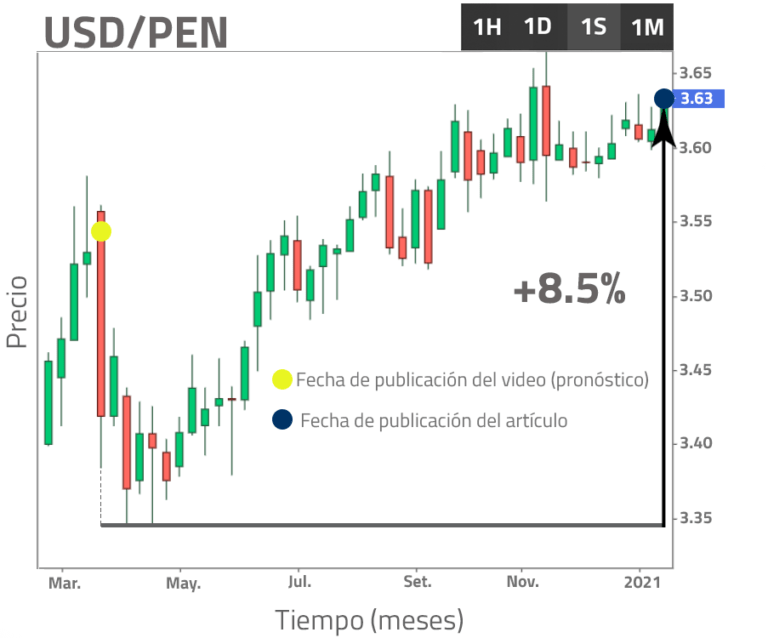
In Fig. 1, the yellow dot indicates the date the prediction was made (March 23rd, 2020). In the minute 17:04 of the aforementioned Youtube video, I stated that the USD/PEN exchange rate was meant to fall and I suggested to buy back dollars at the value of 3.35 PEN (black horizontal line in Fig. 2). In case your local currency would have been another one, it was enough to be aware of the USD/PEN fluctuation and by the time the dollar touched 3.35 PEN, it was also a good time to buy dollars with your local currency. If you would have followed this advice, by January 2021 you would have been with a positive gain of +8.5%, which is much higher than the regular gains obtained with a bank, but how I was capable of knowing this exact value? The answer is hidden in the technical analysis of support and resistance, which is explained in the video: "Japanese candlesticks."
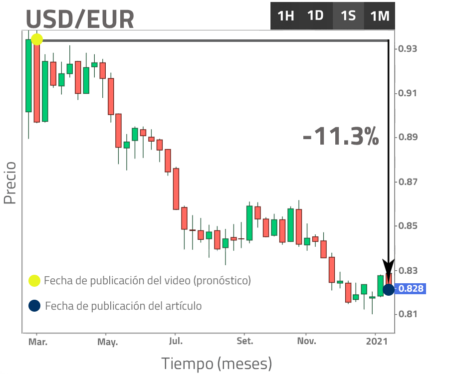
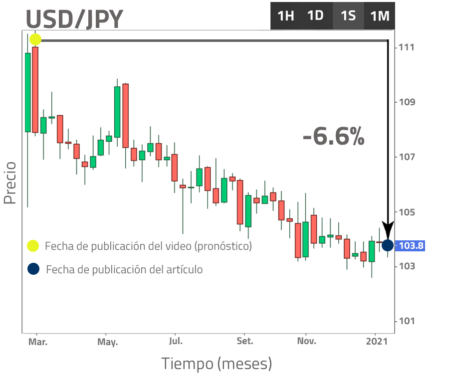
To verify the two remaining predictions, it would be enough to observe the charts given in Figs. 2(a) and 2(b). As we can see, the yen effectively became stronger against the dollar. In other words, if you kept dollars with you and did not exchange them for yens during the year 2020, then you lost the chance to increase your money by 6.6%. Something similar happened with the euros, which appreciated 11.3% against the dollar, in other words, the euro became the strongest out of these three currencies. As you may notice, I failed on the third prediction. Why? Mainly because when I made the forecast in March, the countries had not yet specified how much money they were going to print, I assumed that Europe was going to print much more because this region of the world became the new epicenter of COVID-19, but it was not the case. In the following table we compare the respective stimuli of the three regions in question:
As we can see in Table IV, it was the USA that printed the most and not Europe. Moreover, although Europe printed more than Japan, the amount represents barely 5% of the region's gross domestic product (GDP). In Japan, on the other hand, the printed money reached 20% of its GDP. These data were given in the months of May and June, which means that my forecasts changed as soon as I had access to this information, that is, I started buying euros in the month of May because I was convinced that they would have to grow. However, I didn't make this public; therefore, 2 checks, 1 mistake.
Stock market
The third market to study is the stock market. First I discuss the forecasts given in my Twitter account, for this I show you the percentage growth from the date I bought shares of a company (defined in my tweets) to the date I wrote this article (January 18th, 2021). These results appear below:
As you can see in Table V, in the given period, all my investments were positive, and most of them had a two-digit percentage gain. A complete analysis of why I chose these companies is given in the article: "How to make explosive gains in the stock market." Now, let's discuss the following forecast that was posted as a comment in the forum of Investing:
On September 03rd, 2020, when Signet Jewelers' share price was near 20 USD, I glimpsed a new high at 25 USD, and this was because, thanks to the COVID-19, the company made the right decision to leave the retail sector and become an e-commerce business. Eventually, by January 2021, Signet Jewelers' shares surpassed 40 USD.
Finally, the last predictions to discuss are given in the following videos:
Twitter and Facebook bad investments.
Capital increase of a public company.
These are summarized, respectively, in the following table:
The forecasts given in Table VII are also registered, respectively, in the following articles: i) "Football: bookmaker versus stock market," ii) "Profits with Facebook and Twitter making bad investments," and iii) "How does a capital increase of a public company work." Let's discuss first the Twitter and Facebook investments, where I showed that while one can make bad investments in the short term, in the long term, as long as you continue to buy more shares at lower prices, they can transform into good investments. So the key to make a successful trade is to find the lowest price that a share may have and buyback then. For Twitter, in particular, I considered the minimum to be at 30 USD and I said that every time Twitter would touch this value again I would not hesitate to buy more shares. Indeed, in the year 2019, Twitter shares fell to 30 USD and then, exactly one year later, these shares jumped to 55 USD... Now let's discuss the two remaining articles, which are predictions related to football. In the first one I stated that it was a good decision to buy Ajax shares just after they beat Juventus in the 2018-2019 Champions League. Although Ajax did not reach the final match in the tournament, its shares grew by 40% just for reaching the semifinal. In this sense, the prediction was correct; however, although I was right on that side, investing in Juventus was a total mistake... As you know, over time, Juventus did not grow again, and with the COVID-19 pandemic the situation became even worse. I eventually sold all my shares at a loss. Therefore 13 checks, 1 mistake.
To end, summing up all my predictions we have, 19 checks, 2 mistakes. This gives me a credibility of 90.5%. Of course, if we just focus on the gains, I could say that my credibility is much higher, because certainly the only investment that would have given you losses would have been Juventus shares.
Views: 1
Notifications
Receive the new articles in your email
